
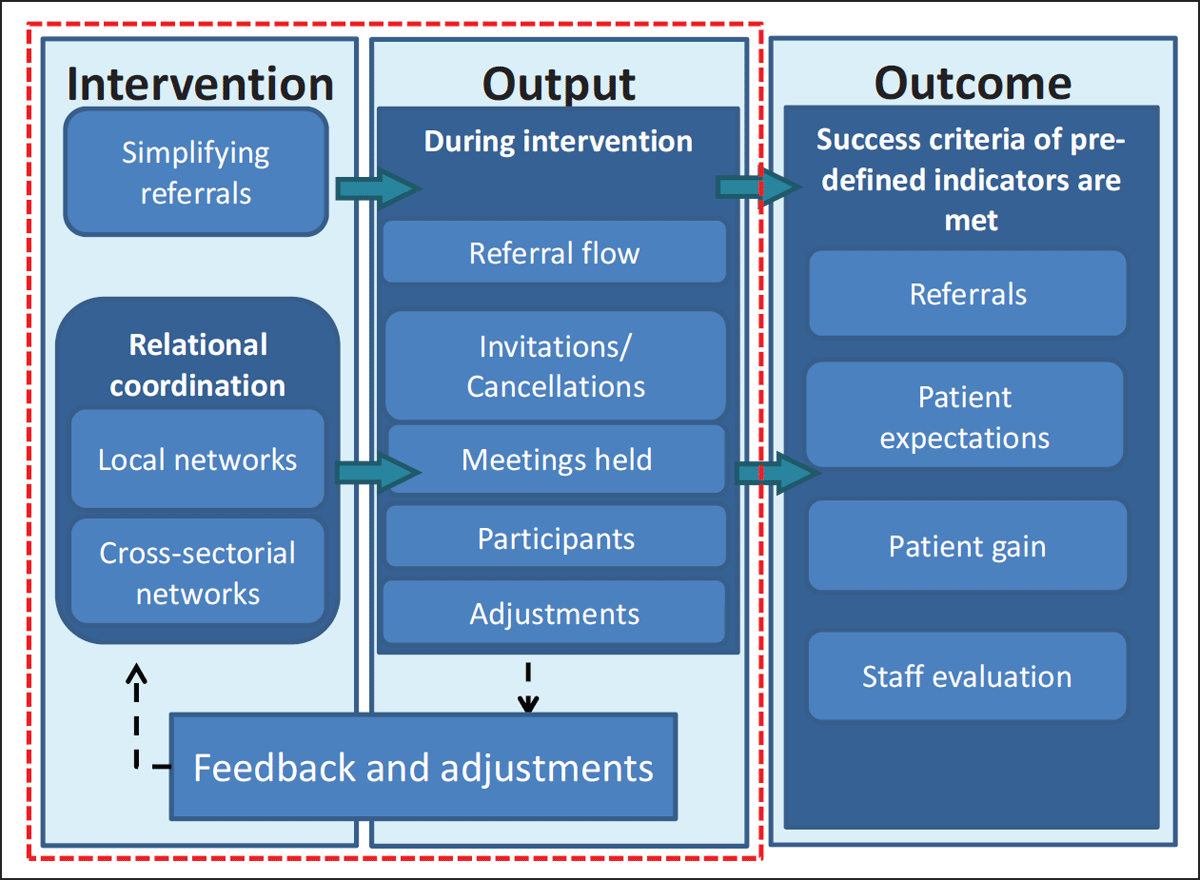
Figure 1
Conceptual model of the intervention.
Table 1
Implementation of findings from part one and lessons learnt during the process.
| IMPROVEMENT INITIATIVE | LESSON LEARNT |
|---|---|
| Simplifying referrals | |
|
|
|
|
|
|
| Relational coordination | |
|
|
| INTERVENTION | INDICATOR | REGISTRATION | MEASUREMENT INTERVAL | SUCCESS CRITERIA |
|---|---|---|---|---|
| Local COPD network | Number of meeting invitations | All invitations including agendas are stored at the SharePoint site of the project | Quarterly | All invitations must include a structured agenda |
| Number of meetings that have been held | All summaries from the meetings are stored at the SharePoint site of the project | Quarterly | Minimum three meetings per year have to be held | |
| Number of cancellations | Cancellations are registered in the calendar at the SharePoint site | Quarterly | None of the planned meetings are cancelled | |
| Number of participants | Extracted from summary at the SharePoint site | Quarterly | Full participation at all meetings | |
| Knowledge of the network | Questionnaires are sent electronically to relevant employees through REDCap Randomly selected interviews | At the end of the intervention Interviews and questionnaires at 3 and 12 months (24 months) | Minimum 80% have knowledge of the local network, and interviews indicate importance | |
| Cross-sectorial COPD network | Number of meeting invitations | All invitations including agendas are stored at the SharePoint site of the project | Quarterly | All invitations must include a structured agenda |
| Number of meetings that have been held | All summaries from the meetings are stored at the SharePoint site of the project | Quarterly | Minimum three meetings per year have to be held | |
| Number of cancellations | Cancellations are registered in the calendar at the SharePoint site | Quarterly | None of the planned meetings are cancelled | |
| Number of participants | Extracted from summary at the SharePoint site | Quarterly | Full participation at all meetings | |
| Knowledge of the network | Questionnaires are sent electronically to relevant employees through REDCap Randomly selected interviews | At the end of the intervention Interviews and questionnaires at 3 and 12 months (24 months) | Minimum 80% have knowledge of the local network, and interviews indicate importance | |
| Patient experience | Indicator | Registration | Measurement interval | Success criteria |
| Expectations | Number of patients whose expectations are fulfilled | Questionnaires are sent electronically to participants through REDCap prior to and after the rehabilitation | Prior to the initial visitation in the municipality and after rehabilitation | Minimum 80% of the participants indicate that rehabilitation has fulfilled their expectations |
| Gain of rehabilitation | Number who found rehabilitation worthwhile | Questionnaires are sent electronically to participants through REDCap after rehabilitation | After rehabilitation | Minimum 90% of the participants indicate that rehabilitation was worthwhile |
| Proportion of patients with increased quality of life | Questionnaires are sent electronically to participants through REDCap after rehabilitation | After rehabilitation | Minimum 90% of the participants indicate that rehabilitation has increased their quality of life | |
| Proportion of patients who obtained predefined goals of rehabilitation | Extracted and analysed from participants’ initial goalsetting in the municipality | At the end of the intervention | Minimum 80% of the participants indicate that they have obtained their predefined goals of rehabilitation | |
| Patient experiences with rehabilitation | SPOT questionnaire Randomly selected interviews | Quarterly interviews | Interviews to qualify how referral, visitation and rehabilitation are experienced | |
| Quality of the cross-sectorial pathway | Indicator | Registration | Measurement interval | Success criteria |
| Outcome of the intervention | Number of referrals | Registry data from hospital and municipality | Quarterly | Minimum 90% of patients admitted/diagnosed with an episode of COPD referred to municipality visitation |
| Number of patients with only the initial visitation | Registry data from hospital and municipality | Quarterly | Proportion of patients only seen at initial visitation increases by maximum 10% | |
| Staff evaluation of the intervention | Randomly selected interviews | At the end of the intervention | Interviews to indicate if the intervention has created more focus on rehabilitation |