
Table 1
Predefined parameters for continuous candidate predictor variables.
| CANDIDATE PREDICTOR VARIABLE | PARAMETER(S) |
|---|---|
| Age | ≥65 years [28] |
| Number of comorbidities | 0, 1, ≥2 [29] |
| Glasgow Coma Scale | <15 [2930] |
| Systolic blood pressure | ≤100 mmHg [12] |
| Respiratory rate | 20–29 breaths/min, ≥30 breaths/min [29] |
| Heart rate | >90 beats/min [31] |
| Peripheral oxygen saturation on room air | <92% [29] |
| Temperature | >38°C or <36°C [31] |
Table 2
Characteristics of study population.
| CHARACTERISTIC | OVERALL COHORT (N = 467) | SURVIVOR COHORT (N = 228) | NON-SURVIVOR COHORT (N = 239) | |||
|---|---|---|---|---|---|---|
| n (%) OR MEDIAN (IQR) | TOTAL NO PATIENTS (%) | n (%) OR MEDIAN (IQR) | TOTAL NO PATIENTS (%) | n (%) OR MEDIAN (IQR) | TOTAL NO PATIENTS (%) | |
| In-hospital mortality | 239 (51.2) | 467 (100.0) | 0 (0.0) | 228 (100.0) | 239 (100.0) | 239 (100.0) |
| Positive PCR testing result | 133 (75.1%) | 177 (37.9) | 74 (81.3) | 91 (39.9) | 59 (68.6) | 86 (40.0) |
| DEMOGRAPHICS | ||||||
| Age (years) | 65 (19) | 467 (100.0) | 61 (21.3) | 228 (100.0) | 70 (16) | 239 (100.0) |
| Male sex at birth | 328 (70.2) | 149 (63.4) | – | 179 (74.9) | – | |
| COMORBIDITIES* | ||||||
| Alcohol use | 10 (2.3) | 441 (21.8) | 5 (2.3) | 218 (95.6) | 5 (2.2) | 223 (93.3) |
| Cardiovascular disease | 50 (11.3) | – | 26 (11.9) | – | 24 (10.8) | – |
| Chronic respiratory disease | 39 (8.8) | – | 19 (8.7) | – | 20 (9.0) | – |
| Rheumatic/connective tissue disease | 4 (0.9) | – | 1 (0.4) | – | 3 (1.3) | – |
| Chronic neurological disease | 32 (7.3) | – | 14 (6.4) | – | 18 (8.1) | – |
| Cirrhosis | 5 (1.1) | – | 3 (1.4) | – | 2 (0.9) | – |
| Chronic kidney disease | 34 (7.7) | – | 17 (7.8) | – | 17 (7.6) | – |
| Diabetes (type 1 and 2) | 190 (43.1) | – | 74 (33.9) | – | 116 (52.0) | – |
| Hypertension | 207 (49.6) | – | 79 (36.2) | – | 128 (57.4) | – |
| Hypothyroid | 3 (0.7) | – | 2 (0.9) | – | 1 (0.4) | – |
| Malignancy | 16 (3.6) | – | 5 (2.3) | – | 11 (4.9) | – |
| Current or former smoker | 30 (6.8) | – | 10 (4.6) | – | 20 (9.0) | – |
| Current pregnancy** | 1 (0.7) | 82 (59.0) | 0 (0.0) | 37 (46.8) | 1 (1.6) | 45 (75.0) |
| Total no. comorbidities | ||||||
| 0 | 100 (22.7) | 441 (94.4) | 66 (30.3) | 218 (95.6) | 34 (15.2) | 223 (93.3) |
| 1 | 150 (34.0) | – | 80 (36.7) | – | 70 (31.4) | – |
| ≥2 | 191 (43.3) | – | 72 (33.0) | – | 119 (53.4) | – |
| PRESENTING SIGNS & SYMPTOMS | ||||||
| Abdominal pain and/or distention | 12 (3.0) | 394 (84.4) | 10 (5.1) | 196 (86.0) | 2 (1.0) | 198 (82.8) |
| Anorexia, nausea, and/or vomiting | 33 (8.4) | – | 18 (9.2) | – | 15 (7.6) | – |
| Chest pain or tightness | 11 (2.8) | – | 5 (2.6) | – | 6 (3.0) | – |
| Convulsions | 4 (1.0) | – | 1 (0.5) | 3 (1.5) | – | |
| Cough | 136 (34.5) | – | 66 (33.7) | – | 70 (35.4) | – |
| Diarrhoea | 12 (3.0) | – | 7 (3.6) | – | 5 (2.5) | – |
| Fatigue | 58 (14.7) | – | 31 (15.8) | – | 27 (13.6) | – |
| Fever | 121 (30.7) | – | 67 (34.2) | – | 54 (27.3) | – |
| Headache | 34 (8.6) | 19 (9.7) | – | 15 (17.6) | – | |
| Internal bleeding*** | 9 (2.3) | – | 4 (2.0) | – | 5 (2.5) | – |
| Myalgia | 10 (2.5) | – | 5 (2.6) | – | 5 (2.5) | – |
| Shortness of breath | 268 (68.0) | – | 125 (63.8) | – | 143 (72.2) | – |
| Sore throat | 25 (6.3) | – | 14 (7.1) | – | 11 (5.6) | – |
| VITAL SIGNS | ||||||
| Glasgow Coma Scale score | 15 (1.0) | 375 (80.3) | 15 (0.0) | 179 (78.5) | 14 (3.3) | 196 (82.0) |
| Heart rate (beat/min) | 96 (24.0) | 375 (80.3) | 93 (21.0) | 195 (85.5) | 100.0 (22.0) | 180 (75.3) |
| Peripheral oxygen saturation (%)**** | 91 (11.3) | 372 (79.7) | 94 (7.0) | 186 (81.6) | 87 (17.0) | 186 (77.8) |
| Systolic blood pressure (mmHg) | 130 (29.5) | 367 (78.6) | 131 (24.8) | 195 (85.5) | 123.5 (39.0) | 173 (72.4) |
| Respiratory rate (breaths/min) | 28 (12.0) | 409 (87.6) | 25 (9.0) | 194 (85.1) | 30 (14.5) | 215 (90.0) |
| Temperature (°C) | 36.9 (1.5) | 62 (13.3) | 36.6 (1.4) | 27 (11.8) | 36.9 (1.6) | 35 (14.6) |
[i] PCR: Polymerase chain reaction
* Some comorbidities have been collapsed into the following clinically meaningful categories:
Cardiovascular disease includes one or more of the following: atrial fibrillation, congestive heart failure, coronary artery disease, deep vein thrombosis, dilated cardiomyopathy, ischaemic heart disease, myocardial infarction, and small vessel disease.
Chronic respiratory disease includes one or more of the following: asthma, chronic obstructive pulmonary disease, and tuberculosis.
Rheumatic/connective tissue disease includes one or more of the following: gout, lupus, and rheumatoid arthritis.
Chronic neurological disease includes one or more of the following: epilepsy, haemorrhagic or ischaemic stroke, and Parkinson’s disease.
** Considered in female subpopulation only (n = 139).
*** Internal bleeding includes one or more of the following: gastrointestinal bleeding, haematuria, or haemoptysis.
**** Peripheral oxygen saturation obtained on room air.
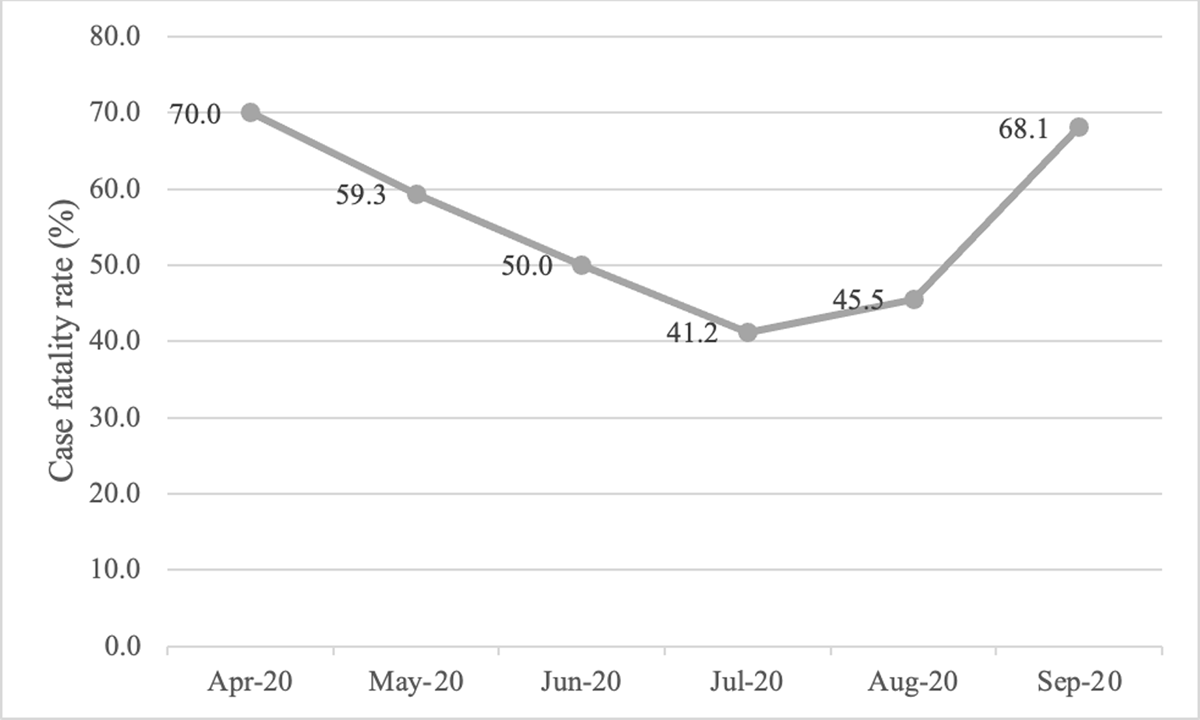
Figure 1
COVID-19 case fatality rates at two government referral hospitals in Sudan from April to September 2020.
Table 3a
AFEM COVID-19 Mortality Scale (AFEM-CMS) for in-hospital mortality due to COVID-19 in low-resource settings with access to pulse oximetry.
| VARIABLE | SCORE |
|---|---|
| Sex at birth | |
| Female | 0 |
| Male | 1 |
| Age (years) | |
| <65 | 0 |
| ≥65 | 1 |
| No. of comorbidities* | |
| <2 | 0 |
| ≥2 | 1 |
| Glasgow Coma Scale | |
| 15 | 0 |
| <15 | 2 |
| Systolic blood pressure (mmHg) | |
| >100 | 0 |
| ≤100 | 1 |
| Respiratory rate (breaths/min) | |
| <20 | 0 |
| ≥20 | 1 |
| Peripheral oxygen saturation on room air (%) | |
| ≥92 | 0 |
| <92 | 2 |
[i] * Comorbidities are defined as follows: Alcohol use, cardiovascular disease (one or more of the following: atrial fibrillation, congestive heart failure, coronary artery disease, deep vein thrombosis, dilated cardiomyopathy, ischaemic heart disease, myocardial infarction, and small vessel disease), chronic respiratory disease (one or more of the following: asthma, chronic obstructive pulmonary disease, and tuberculosis), chronic neurological disease (one or more of the following: epilepsy, haemorrhagic or ischaemic stroke, and Parkinson’s disease), cirrhosis, chronic kidney disease, current or former smoker status, diabetes (types 1 and 2), hypertension, hypothyroid, and malignancy.
Table 3b
AFEM COVID-19 Mortality Scale (AFEM-CMS) for in-hospital mortality due to COVID-19 in low-resource settings without access to pulse oximetry.
| VARIABLE | SCORE |
|---|---|
| Sex at birth | |
| Female | 0 |
| Male | 1 |
| Age (years) | |
| <65 | 0 |
| ≥65 | 1 |
| No. of comorbidities* | |
| <2 | 0 |
| ≥2 | 1 |
| Glasgow Coma Scale score | |
| 15 | 0 |
| <15 | 2 |
| Systolic blood pressure (mmHg) | |
| >100 | 0 |
| ≤100 | 2 |
| Respiratory rate (breaths/min) | |
| <20 | 0 |
| ≥20 | 1 |
| Heart rate (beats/min) | |
| ≤90 | 0 |
| >90 | 1 |
[i] * Comorbidities are defined as follows: Alcohol use, cardiovascular disease (one or more of the following: atrial fibrillation, congestive heart failure, coronary artery disease, deep vein thrombosis, dilated cardiomyopathy, ischaemic heart disease, myocardial infarction, and small vessel disease), chronic respiratory disease (one or more of the following: asthma, chronic obstructive pulmonary disease, and tuberculosis), chronic neurological disease (one or more of the following: epilepsy, haemorrhagic or ischaemic stroke, and Parkinson’s disease), cirrhosis, chronic kidney disease, current or former smoker status, diabetes (types 1 and 2), hypertension, hypothyroid, and malignancy.
Table 4
Mortality risk stratification based on AFEM COVID-19 Mortality Scale (AFEM-CMS) scores.
| MORTALITY RISK | AFEM-CMS SCORE |
|---|---|
| <33% | 0 to 2 |
| 33% to 66% | 3 to 5 |
| >66% | 6 to 9 |
Table 5
Comparison of mortality risk rates by mortality risk group for 467 COVID-19 patients used to train the AFEM COVID-19 Mortality Scale (AFEM-CMS).
| MORTALITY RISK GROUP | SCORE | NO SPO2 SCORE | SPO2 SCORE | ||||
|---|---|---|---|---|---|---|---|
| NO. PATIENTS | NO. FATALITIES | CFR (%) | NO. PATIENTS | NO. FATALITIES | CFR (%) | ||
| <33% | 0 to 2 | 68 | 5 | 7.4 | 84 | 5 | 6.0 |
| 33% to 66% | 3 to 5 | 267 | 124 | 46.4 | 221 | 103 | 46.6 |
| >66% | 6 + | 132 | 110 | 83.3 | 162 | 131 | 80.9 |
[i] * CFR: Case fatality rate.
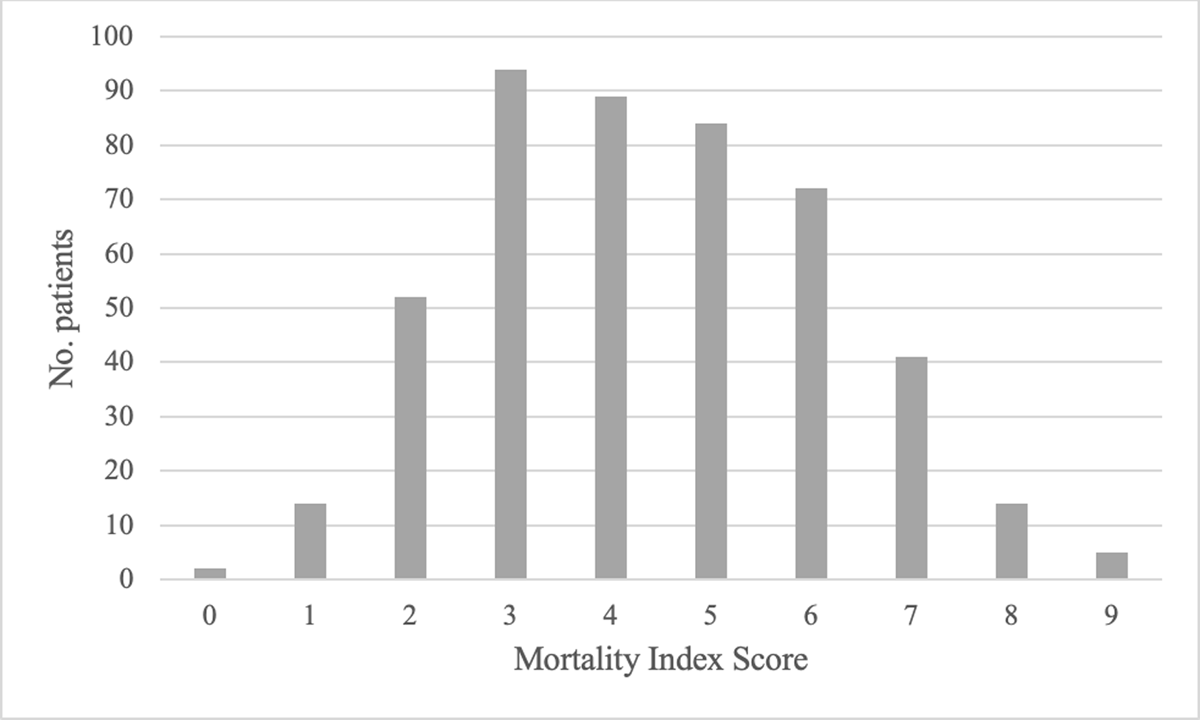
Figure 2a
Distribution of patients across AFEM COVID-19 Mortality Scale (AFEM-CMS) scores in derivation cohort, for resource settings with access to pulse oximetry.
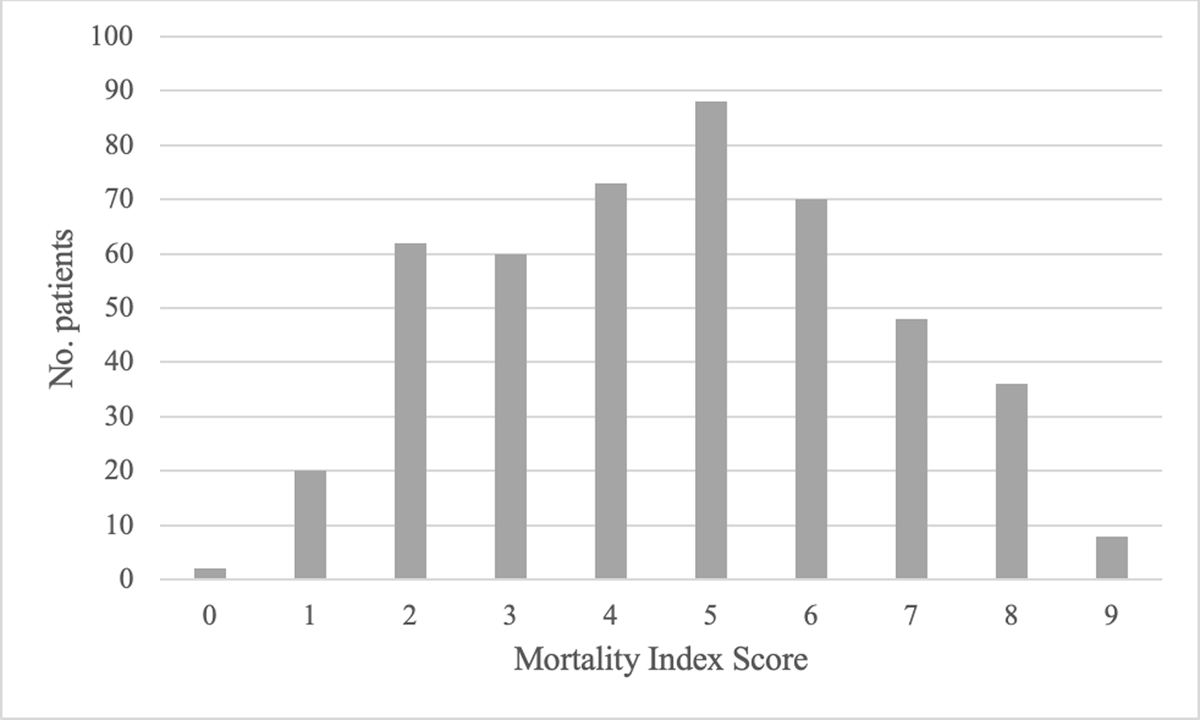
Figure 2b
Distribution of patients across AFEM COVID-19 Mortality Scale (AFEM-CMS) scores in derivation cohort, for resource settings without access to pulse oximetry.