
| No | Type of cancer n (%) | Aims/scope of cancer risk and prevention studies done in Uganda from January 2000 to January 2020 |
|---|---|---|
| 1 | Cervical 18 (23.4%) | These studies assessed awareness about cervical cancer risk factors, perceptions and attitudes, uptake of human papillomavirus (HPV) vaccination, sexual behaviour of the HPV-vaccinated and non-vaccinated young girls, perceived barriers to cervical screening, knowledge and attitudes of men about HPV, healthcare, patients’ factors and stage at diagnosis, self versus clinic-based collection of HPV specimens for cervical screening. Functional cervical health literacy, the intention of women to screen for cervical cancer, uptake and correlates of cervical screening among HIV-infected women, uptake of cervical cancer screening in rural communities, perceptions of community members on integration of cervical screening in HIV clinics, and acceptability of cervical screening integration into immunization clinics were also assessed. |
| 2 | Lymphomas 16 (20.7%) | These studies described the epidemiology of Epstein-Barr virus (EBV), prevalence of EBV, human herpes virus 8 (HHV-8), and human immunodeficiency virus (HIV)-1 in B-cell non-Hodgkin lymphoma, age-specific patterns of Burkitt lymphoma (BL) cases, malaria, and risk of endemic Burkitt lymphoma (eBL) and factors associated with time to diagnosis of BL cases. The next-generation sequencing (NGS) to detect B-cell receptor (BCR) gene rearrangements in eBL, oral human herpes virus shedding kinetics, EBV viral load, and serology were investigated. |
| 3 | Breast 12 (15.6%) | These studies investigated breastfeeding and breast cancer risk, impact of alcohol, effect of knowledge on prevention, perceived barriers to early detection, role of high serum estradiol, role of blood folate level, and risk of breast cancer by ER status. Breast self-examination practices, role of family obligation, and stress on women’s participation in preventive breast health services, efficacy of mass self-breast screening, relationship between benign breast tumour (BBD) and breast cancer, full-term pregnancy, and breast cancer risk were investigated. |
| 4 | Kaposi sarcoma 4 (5.1%) | These studies investigated the human herpes virus (HHV-8) DNA in plasma, characterized the HHV-8 transcriptome, the HHV-8 gene expression in KS tumors for identification of candidate biomarkers, and risk factors for HHV-8 DNA detection. |
| 5 | Esophageal and other gastrointestinal, excluding liver 3 (3.8%) | These studies determined the prevalence, trend, and distribution of gastrointestinal malignancies and estimated the population attributable fraction of smoking and alcohol to esophageal squamous cell carcinoma (ESCC) and characterized the burden of esophageal cancer. |
| 6 | Liver 4 (5.1%) | These studies focused on the prevalence of hepatitis B virus (HBV) infection, its risk factors and evaluated the prevention-behavioral intentions in regard to HBV and liver cancer. |
| 7 | Prostate 2 (2.6%) | These studies assessed the knowledge, attitudes, and practices of men regarding risk, prevention, and screening for prostate cancer. |
| 8 | Conjunctival 2 (2.6%) | Factors associated with conjunctival cancer, determining if conjunctival squamous cell carcinoma (CSCC) harbors human HPV DNA and if CSCC is associated with activation of epidermal growth factor receptor (EGFR) signaling pathway were investigated. |
| 9 | HIV and cancer 6 (7.8%) | These studies evaluated the association between anti-retroviral treatment (ART) and cancer incidence, how HIV infection influences the presentation and manifestation of cancer, HIV infection and stage of cancer at presentation for treatment. The role of HIV in cancer survival and well-being of cancer patients, frequency of genital HSV shedding in HIV-seropositive versus HIV-seronegative men and women were also evaluated. |
| 10 | NCDs-cancer related risk 5 (6.5%) | These studies described the prevalence of risk factors for non-communicable diseases (NCDS), including tobacco use and alcohol consumption in Uganda and assessed the willingness of tobacco farmers to stop growing tobacco. |
| 11 | Trend in cancer incidence 3 (4.0%) | These studies described the trends of the commonest cancers in Uganda using data from Kampala and Gulu population-based cancer registries. |
| 12 | Anogenital 1 (1.3%) | This study assessed the risk factors of anogenital warts. |
| 13 | Breast & cervical awareness tool 1 (1.3%) | This study developed and validated breast and cervical cancer awareness assessment tool. |
Table 1
Summary of quantitative findings of cervical cancer risk studies conducted in Uganda from January 2000 to January 2020.
| No | Authors, year | Study types | Sample size | Factor | Effect measure | Effect size (95% CI) | P-value |
|---|---|---|---|---|---|---|---|
| 1 | Mukama et al. 2017 [4] | Cross-sectional | 900 | Knowledge of at least one preventive measure of CC among women in Eastern Uganda | Proportion | 62.4% | |
| 2 | Mwaka et al. 2015 [519] | Cross-sectional | 448 | Knowledge of CC risk factors among women in northern Uganda | Proportion | 82.6% | |
| 3 | Mukama et al. 2017 [4] | Cross-sectional | 900 | Perceived risk of CC | Proportion | 76% | |
| 4 | Mutyaba et al. 2006 [7] | Cross-sectional | 300 | Knew at least one risk factors of CC | Proportion | 40% | |
| 5 | Mwaka et al. 2015 [5] | Cross-sectional | 149 | Financial difficulties and risk of late diagnosis | aOR | 5.5 (1.58, 20.64) | |
| 6 | Mwaka et al. 2015 [5] | Cross-sectional | 149 | Late referral and risk of late diagnosis | aOR | 13.0 (3.59–47.3) | |
| 7 | Mwaka et al. 2015 [5] | Cross-sectional | 149 | 5–9 biological children and risk of late-diagnosis | aOR | 0.27 (0.08– 0.96) | |
| 8 | Campos et al. 2017 [119] | Monte Carlo simulation model | – | HPV self-collection efficiency versus clinic sampling. | Minimum coverage for efficiency | 75% | |
| 9 | Twinomujuni et al. 2015 [9] | Cross-sectional | 416 | Ever-screened for cervical cancer | Proportion | 7% | |
| 10 | Twinomujuni et al. 2015 [9] | Cross-sectional | 416 | Intention to screen among those with sexual partner. | aPR | 1.4 (1.11–1.68) | |
| 11 | Twinomujuni et al. 2015 [9] | Cross-sectional | 416 | Intention to screen among those unafraid of positive result | aPR | 1.6 (1.36–1.93) | |
| 12 | Twinomujuni et al. 2015 [9] | Cross-sectional | 416 | Intention to screen among those with perceived high risk of CC | aPR | 2.0 (1.60–2.58) | |
| 13 | Wanyenze et al. 2017 [10] | Cross-sectional | 5198 | Screening uptake among HIV-infected | % coverage | 30.3% | |
| 14 | Wanyenze et al. 2017 [10] | Cross-sectional | 5198 | Lack of time for screening among HIV-infected | Proportion | 25.5% | |
| 15 | Ndejjo et al. 2017 [4] | Cross-sectional | 900 | Intention to screen in general population | Proportion | 91% | |
| 16 | Ndejjo et al. 2017 [4] | Cross-sectional | 900 | Willing to vaccinate their daughters against cervical cancer | Proportion | 90.4% | |
| 17 | Ndejjo et al. 2016 [16] | Cross-sectional | 900 | Health worker’s advice as predictor for screening | aOR | 87.85 | 0.001 |
| 18 | Ndejjo et al. 2016 [16] | Cross-sectional | 900 | Knowing where screening services are offered as predictor for screening | aOR | 6.24 | 0.004 |
| 19 | Ndejjo et al. 2016 [16] | Cross-sectional | 900 | Knowing someone who had ever been screened as predictor for screening | aOR | 9.48 | 0.001 |
| 20 | Banura et al. 2008 [14] | Cross-over Case-control | 987 | Prevalence of HPV among women | PR | 60% | |
| 21 | Kisakye et al. 2018 [15] | Cross-sectional | 460 | Uptake of HPV vaccination | % coverage | 17.61% | |
| 22 | Kisakye et al. 2018 [15] | Cross-sectional | 460 | Effect of higher level of education on HPV vaccination uptake | aPR | 1.48 (1.11–1.97) | |
| 23 | Kisakye et al. 2018 [15] | Cross-sectional | 460 | Effect of positive attitude on HPV vaccination uptake | aPR | 3.46 (1.70–7.02) | |
| 24 | Kisakye et al. 2018 [15] | Cross-sectional | 460 | Effect of health worker’s advice on HPV vaccination uptake. | aPR | 1.55 (1.15–2.11) | |
| 25 | Kisakye et al. 2018 [15] | Cross-sectional | 460 | Effect of Village Health Team on HPV vaccination uptake | aPR | 3.47 (1.50–8.02) | |
| 26 | Kisakye et al. 2018 [15] | Cross-sectional | 460 | Effect of community outreaches on HPV vaccination uptake | aPR | 1.47 (1.02–2.12) | |
| 27 | Kisakye et al. 2018 [15] | Cross-sectional | 460 | Effect of HPV vaccine availability on HPV vaccination uptake | aPR | 4.84 (2.90–8.08) | |
| 28 | Moses et al. 2018 [120] | Cross-sectional | 60 | Men who have ever heard of HPV | % proportion | 24.6% | |
| 29 | Wawer et al. 2018 [18] | Randomised trial | 544 IG, 488 CG | Incidence of high-risk HPV infection is lower in women with circumcised sexual partners compared to uncircumcised. | IRR | 0·77 (0·63–0·93) | 0·008 |
| 20 | Li et al. 2017 [121] | Cross-sectional | 571 | Effect of age on acceptability of cervical screening | OR | 1.10 | <0.001 |
| 31 | Li et al. 2017 [121] | Cross-sectional | 571 | Effect of employment on acceptability of cervical screening | OR | 2.00 | 0.019 |
[i] * aPR = adjusted prevalence ratio, OR = Odds ratio, aOR = adjusted odds ratio, IRR = Incidence rate ratio, CC = cervical cancer, CI = confidence interval, IG = Intervention group, CG = Control group.
Table 2
Summary of quantitative findings on lymphomas’ risk studies conducted in Uganda from January 2000 to January 2020.
| No | Authors, Year | Study types | Sample size | Factor/variable | Effect measure | Effect size (95% CI) | P-value |
|---|---|---|---|---|---|---|---|
| 1 | Orem et al. 2014 [21] | Case- control | 96 cases, 31controls | Whole-blood EBV viral load in BL compared to other NHL | OR | 6.67 (1.32–33.69) | 0.04 |
| 2 | Orem et al. 2014 [21] | Case- control | 96 cases, 31controls | Chronic inflammatory conditions and risk of NHL other than BL | OR | 0.19 (0.07–0.51) | 0.001 |
| 3 | Tumwine et al. 2010 [22] | Cross-sectional | 119 | Prevalence of EBV in BL tumours | PR | 92% | |
| 4 | Tumwine et al. 2010 [22] | Cross-sectional | 119 | Prevalence of EBV in diffuse large B cell lymphomas tumours | PR | 34.8% | |
| 5 | Tumwine et al. 2010 [22] | Cross-sectional | 119 | Prevalence of HHV-8 in BL tumours | PR | 0% | |
| 6 | Tumwine et al. 2010 [22] | Cross-sectional | 119 | Prevalence of HHV-8 in diffuse large B cell lymphomas tumours | PR | 0% | |
| 7 | Gantt et al. 2016 [122] | Panel study | 32 | The 12-month incidence of postnatal infection with HHV-6B. | IR | 76% | |
| 8 | Gantt et al. 2016 [122] | Panel study | 32 | The 12-month incidence of postnatal infection with CMV. | IR | 59% | |
| 9 | Gantt et al. 2016 [122] | Panel study | 32 | The 12-month incidence of postnatal infection with EBV. | IR | 47% | |
| 10 | Gantt et al. 2016 [122] | Panel study | 32 | The 12-month incidence of postnatal infection with, for HSV-1, and 0% for HHV-8. | IR | 8% | |
| 11 | Gantt et al. 2016 [122] | Panel study | 32 | The 12-month incidence of postnatal infection with HHV-8. | IR | 0% | |
| 12 | Gantt et al. 2016 [122] | Panel study | 32 | Association of maternal HIV-1 infection with EBV. | aHR | 7.2 (2.4–22.2) | <.001 |
| 13 | Gantt et al. 2016 [122] | Panel study | 32 | Association of breastfeeding with CMV. | aHR | 5.0 (1.2–21.1) | 0.03 |
| 14 | Gantt et al. 2016 [122] | Panel study | 49 | Association of younger child contacts with CMV. | aHR | 1.4 (1.0–2.0) | 0.04 |
| 15 | Derkach et al. 2019 [27] | Case-control | 343 cases, 750 controls | eBL cases reactivity to severe malaria associated antigens (PfEMP1). | aOR | 0.60 (0.41–0.88) | 0.03 |
| 16 | Derkach et al. 2019 [27] | Case-control | 343 cases, 750 controls | eBL cases reactivity to Pf Malaria SERA5 protein. | X2trend | Ptrend 0.007 | |
| 17 | Derkach et al. 2019 [27] | Case-control | 343 cases, 750 controls | eBL cases reactivity to group A CIDRα1.5 variant. | X2trend | Ptrend 0.034 | |
| 18 | Buckle et al. 2013 [29] | Cross-sectional | 82 | Median time of “total delay” to diagnosis of BL. | Median | 12.9 weeks (IQR 4.3–25.7) | |
| 19 | Buckle et al. 2013 [29] | Cross-sectional | 82 | Median time of “guardian delay” from1st symptoms of BL to 1st health encounter. | Median | 4.3 weeks (Range 0.7–149.9) | |
| 20 | Buckle et al. 2013 [29] | Cross-sectional | 82 | Median time of “health system delay” to 1st health encounter to BL diagnosis. | Median | 2.6 weeks (range 0.1–16.0) | |
| 21 | Maziarz et al. 2017 [25] | Cross-sectional | 1150 | Pf malaria prevalence rate in northern Uganda. | Prevalence rate | 54.8% | |
| 22 | Peprah et al. 2019 [24] | Case-control | 862 cases, 2,934 controls | History of in-patient malaria treatment 12 months ago and risk of eBL | OR | 2.55 (1.39, 4.67) | 0.01 |
| 23 | Peprah et al. 2019 [24] | Case-control | 862 cases, 2,934 controls | Higher maternal income and risk of eBL | OR | 0.27 (0.14–0.52) | P-trend 0.004 |
| 24 | Peprah et al. 2019 [24] | Case-control | 862 cases, 2,934 controls | Higher level of paternal education and risk of eBL | OR | 0.59 (0.39–0.89) | P-trend 0.013 |
| 25 | Peprah et al. 2019 [24] | Case-control | 862 cases, 2,934 controls | Higher maternal education and risk of eBL | OR | 0.51 (0.28–0.96) | P-trend 0.005 |
[i] * aHR = adjusted hazard ratio, IC = incidence rate, PR = prevalence rate, aPR = adjusted prevalence ratio, aOR = adjusted odds ratio, CI = confidence interval, Ptrend = P-value for trend analysis, CMV = cytomegalovirus, EBV = Epstein Barr Virus, HHV = human herpes virus 1, 6, 8. Pf = Plasmodium falciparum, PfEMP1 = Plasmodium falciparum erythrocyte membrane protein-1, SERA5 = Serine repeat antigen 5, CIDRα1.5 = Cysteine-rich interdomain region-α1.5 protein, BL = Burkitt lymphoma, eBL = endemic Burkitt lymphoma, NHL = non-Hodgkin’s lymphoma.
Table 3
Summary of quantitative findings on breast cancer risk studies conducted in Uganda from January 2000 to January 2020.
| No | Authors, Year | Study types | Sample size | Factor | Effect measure | Effect size (95% CI) | P-value |
|---|---|---|---|---|---|---|---|
| 1 | Galukande et al. 2016 [30] | Case-control | 113 cases and 237 | Effect of breastfeeding on the risk of breast cancer | aOR | 0.04 (0.01–0.18) | |
| 2 | Qian et al. 2014 [32] | Case-control | 2138 Cases & 2,589 controls | Current alcohol drinking and risk of breast cancer. | aOR | 1.01 (0.55–1.85) | |
| 3 | Qian et al. 2014 [32] | Case-control | 2138 Cases & 2,589 controls | Past alcohol drinking and risk of breast cancer | aOR | 0.99 (0.57–1.75) | |
| 4 | Awio et al. 2012 [33] | Case-control | 70 Cases & 70 controls | Relationship between level of serum estradiol and breast cancer risk in cases compared to controls | 0.647 | ||
| 5 | Awio et al. 2012 [33] | Case-control | 70 Cases & 70 controls | Higher BMI index and risk of breast cancer | OR | 1.02 (1.01–1.04) | |
| 6 | Awio et al. 2012 [33] | Case-control | 70 Cases & 70 controls | Late onset of menarche and risk of breast cancer | OR | 0.68 (0.52–0.90) | |
| 7 | Atuhairwe et al. 2018 [39] | Cross-sectional | 400 | Relationship between radio as source of information and uptake of breast cancer prevention modalities. | OR | 1.94 (1.16–3.24) | |
| 8 | Atuhairwe et al. 2018 [39] | Cross-sectional | 400 | Relationship between TVs as source of information and uptake of breast cancer prevention modalities. | OR | 1.82 (1.14–2.93) | |
| 9 | Atuhairwe et al. 2018 [39] | Cross-sectional | 400 | Relationship between community cancer awareness by health workers as source of information and uptake of breast cancer prevention modalities. | OR | 4.03 (1.01–15.98) | |
| 10 | Atuhairwe et al. 2018 [39] | Cross-sectional | 400 | Relationship between knowledge of breast cancer risk and uptake of breast cancer prevention modalities. | OR | 1.98 (1.20–3.27) | |
| 11 | Atuhairwe et al. 2018 [39] | Cross-sectional | 400 | Relationship between knowing symptoms of breast cancer and uptake of breast cancer prevention modalities | OR | 3.09 (1.62–5.88) | |
| 12 | Galukande et al. 2013 [123] | Cross-sectional (Analytical) | 113 | ER negative tumors exhibited significantly higher-grade tumors | 0.001 | ||
| 13 | Katende et al. 2016 [37] | Cross-sectional | 204 | Level of breast cancer awareness among Makerere university students. | Proportion | 98.0% | |
| 14 | Katende et al. 2016 [37] | Cross-sectional | 204 | Skills related to breast self-exam (BSE) practices among Makerere university students. | Proportion | 43.6% | |
| 15 | Scheel et al. 2019 [40] | Cross-sectional | 401 | Effect of family obligation (FO) stress on women’s participation in preventive breast health awareness. | Regression PD | –0.02 | 0.008 |
| 16 | Scheel et al. 2019 [40] | Cross-sectional | 401 | Effect of FO stress on women’s participation in breast health check-up. | Regression-PD | –0.02 | 0.018 |
| 17 | Adedokun et al. 2019 [34] | Case-control | @(2405 cases and 2749 controls) | The risk of breast cancer among women with history of benign breast disease compared to those without | aOR | 1.42 (1.13–1.79) | |
| 18 | Sighoko et al. 2015 [31] | Case-control | 1995 cases and 2631 controls | Risk of breast cancer in a parous woman with her first FTP at 20 years relative to nulliparous | OR | 0.76 (0.57–0.99) | |
| 19 | Sighoko et al. 2015 [31] | Case-control | 1995 cases and 2631 controls | Risk of breast cancer in a parous woman with 1 pregnancy relative to nulliparous. | OR | 0.69 (0.49–0.96) | |
| 20 | Sighoko et al. 2015 [31] | Case-control | 1995 cases and 2631 controls | Risk of breast cancer in a parous woman with 2 to 5 pregnancies relative to nulliparous. | 0R | 0.66 (0.48–0.91) | |
| 21 | Sighoko et al. 2015 [31] | Case-control | 1995 cases and 2631 controls | Risk of breast cancer in a parous woman with 6 or more pregnancies | OR | 0.67 (0.47–0.94) |
[i] * OR = Odds ratio, aOR = adjusted odds ratio, CI = confidence interval, PD = Probability difference per 1-point increase, aPR = adjusted prevalence ratio. @ = conducted in Uganda, Nigeria, and Cameroon.
Table 4
Summary of quantitative findings on other cancer risk studies conducted in Uganda from January 2000 to January 2020.
| No | Authors, Year | Study types | Sample size | Factor | Effect measure | Effect size (95% CI) | P-value |
|---|---|---|---|---|---|---|---|
| 1 | Kabwama et al. 2016 [43] | Cross-sectional | 3983 | Prevalence of daily tobacco use | Prevalence rate | 9.2 % | |
| 2 | Kabwama et al. 2016 [43] | Cross-sectional | 3983 | Men are more likely to be daily tobacco users | aOR | 5.51 [3.81–7.95] | |
| 3 | Kabwama et al. 2016 [47] | Cross-sectional | 3,956 | Prevalence of alcohol consumption | Prevalence rate | 26.8% | |
| 4 | Kabwama et al. 2016 [47] | Cross-sectional | 3,956 | Prevalence of high-end alcohol consumption | Prevalence rate | 12.7% | |
| 5 | Mondo et al. 2013 [48] | Cross-sectional | 611 | Physically active status in rural Uganda. | 49% | ||
| 6 | Mondo et al. 2013 [48] | Cross-sectional | 611 | Daily ate five or more servings of fruits in rural Uganda. | Prevalence rate | 7.2% | |
| 7 | Mondo et al. 2013 [48] | Cross-sectional | 611 | Daily ate five or more servings of vegetables in rural Uganda. | Prevalence rate | 1.2% | |
| 8 | Mondo et al. 2013 [48] | Cross-sectional | 611 | Obesity in men in rural Uganda. | Prevalence rate | 4.9% | |
| 9 | Mondo et al. 2013 [48] | Cross-sectional | 611 | Obesity in women rural Uganda. | Prevalence rate | 9.0% | |
| 10 | Shebi et al. 2013 [124] | Cross-sectional | 1,080 KSHV+356 KSHV- | Plasma KSHV DNA in KSHV seropositivity persons. | Prevalence rate | 95% | |
| 11 | Shebi et al. 2013 [124] | Cross-sectional | 1,080 KSHV+356 KSHV- | Plasma KSHV DNA in KSHV seronegative persons. | Prevalence rate | 5% | |
| 12 | Shebi et al. 2013 [124] | Cross-sectional | 1,080 KSHV+356 KSHV- | KSHV DNA quantity in plasma was higher in male sex. | Prevalence rate | 0.002 | |
| 13 | Shebi et al. 2013 [124125] | Cross-sectional | 1,080 KSHV+356 KSHV- | KSHV DNA quantity in plasma was higher in rural compared to urban. | Prevalence rate | 0.002 | |
| 14 | Rose et al. 2018 [126] | Cross-sectional | 22 KS biopsies | KS tumors with a latent phenotype had high levels of total KSHV transcription than tumors with a lytic phenotype | |||
| 15 | Rose et al. 2018 [126] | Cross-sectional | 22 KS biopsies | Morphologically distinct KS tumors from the same individual exhibited similar KSHV gene expression profile. | |||
| 16 | Phipps et al. 2015 [127] | Cross-sectional | 48 KS biopsies | KS tumors expressed high levels of both latent and lytic HHV-8 mRNA transcripts. | |||
| 17 | Phipps et al. 2015 [127] | Cross-sectional | 48 KS biopsies | Genes encoding cytokines (vIL-6), growth regulatory genes (v-CYC), and apoptosis inhibitors (v-FLIP) were associated with different tumor types. | |||
| 18 | Nalwoga et al. 2019 [125] | Cross-sectional | 878 | Detectable KSHV in blood decreases with age | Prevalence rate | 22–23% | |
| 19 | Nalwoga et al. 2019 [125] | Cross-sectional | 878 | Detectable KSHV in saliva increases with age up to 12 years and subsequently decreases with increasing age | Prevalence rate | 30–45% | |
| 20 | Nalwoga et al. 2019 [125] | Cross-sectional | 878 | More males (29%) than females (19%) shed KSHV DNA in saliva. | Prevalence rate | 0.008 | |
| 21 | Nalwoga et al. 2019 [125] | Cross-sectional | 878 | Individuals with a current malaria showed higher levels of KSHV DNA in blood | Prevalence rate | 0.031 | |
| 22 | Ocama et al. 2008 [53] | Cross-sectional | 216 | Esophageal squamous cell carcinoma is most prevalent in Uganda | Prevalence rate | 98% | |
| 23 | Ocama et al. 2008 [53] | Cross-sectional | 216 | Esophageal cancer of upper third is of squamous cell type | Prevalence rate | 100% | |
| 24 | Obayo et al. 2017 [52] | Ecologica | 1468 | The esophageal cancer is commonest gastro-intestinal malignancies over a 10-year period. | Prevalence rate | 28.8% of the GIM | |
| 25 | Obayo et al. 2017 [52] | Ecologica | 1468 | The distribution of gastro-intestinal malignancies differs by regions. | Prevalence rate | 0.001 | |
| 26 | Okello et al. 2016 [54] | Case-control | 67 cases and 142 controls | PAF of ESCC due to smoking. | PAF | 16 | |
| 26 | Okello et al. 2016 [54] | Case-control | 67 cases and 142 controls | PAF ESCC due to alcohol. | PAF | 10 | |
| 27 | Okello et al. 2016 [54] | Case-control | 67 cases and 142 controls | Combined PAF of ESCC due to smoking and alcohol. | PAF | 13% | |
| 28 | Bwogi et al. 2009 [55] | Cross-sectional | 5875 | National prevalence of hepatitis B virus (HBV) infection by HBsAg test. | Prevalence rate | 10.3% (9.5–11.1) | |
| 29 | Bwogi et al. 2009 [55] | Cross-sectional | 5875 | Prevalence of HBV infection is highest in North-Eastern Uganda. | Prevalence rate | 23.9% | < 0.001 |
| 30 | Bwogi et al. 2009 [55] | Cross-sectional | 5875 | Prevalence of HBV infection in Northern Uganda is the second highest. | Prevalence rate | 20% | < 0.001 |
| 31 | Nankya-Mutyoba et al. 2019 [128] | Cross-sectional | 455 | Perceived risk and intention to screen for HBV was inversely associated. | PRR | 0.95(0.90–1.00) | 0.055 |
| 32 | Nankya-Mutyoba et al. 2019 [128] | Cross-sectional | 455 | Perceived self-efficacy was positively associated with intention to screen for HBV. | PRR | 1.18(1.10–1.23) | 0.005 |
| 33 | Kang et al. 2015 [59] | Longitudinal evaluation | 713 | Prevalence of aflatoxin in human serum | Prevalence | 90% | |
| 34 | Du Z et al. 2018 [50] | Case-control | 571 cases and 485 controls | In GWAS, the 8q24 risk region including rs72725854 was found a major contributor to Pca risk in Ugandan men | OR | 3.37 | P = 2.14 × 10⁻¹¹ |
| 35 | Du Z et al. 2018 [50] | Case-control | 571 cases and 485 controls | Proportion of Pca risk accounted for by the African ancestry-specific risk variant rs72725854. | Proportion | 12% | |
| 36 | Nakandi et al. 2013 [49] | Cross-sectional | 545 | Perceived susceptibility to Pca risk | Proportion | 63.5% | |
| 37 | Nakandi et al. 2013 [49] | Cross-sectional | 545 | Intention to screen for Pca | Proportion | 22.9% | |
| 38 | Nakandi et al. 2013 [49] | Cross-sectional | 545 | Knowledge on Pca risk | Proportion | 10.3% | |
| 39 | Newton et al. 2002 [129] | Case-control | 60 cases and 1214 controls | Conjunctival cancer was positively associated with HIV infection | OR | 10(5.2–19.4) | <0.001 |
| 40 | Yu et al 2010 [130] | Cross-sectional | 38 | Prevalence of HPV-18 genotype in conjunctival tumours | Prevalence rate | 61% | |
| 41 | Yu et al 2010 [130] | Cross-sectional | 38 | Prevalence of HPV-16 genotype in conjunctival tumours | Prevalence rate | 16% | |
| 42 | Yu et al 2010 [130] | Cross-sectional | 38 | Relationship between cytoplasmic p-MAPK and conjunctival tumor invasiveness. | 0.05 or | ||
| 43 | Yu et al 2010 [130] | Cross-sectional | 38 | Relationship between cytoplasmic p-Akt and conjunctival tumor invasiveness. | 0.028 | ||
| 44 | Yu et al 2010 [130] | Cross-sectional | 38 | Relationship between EGFR signaling pathway expression and conjunctival tumor invasiveness | 0.01 | ||
| 45 | Mutyaba et al. 2015 [131] | Ecological | 12,263 | Availability of ART decreased the incidence of KS. | Proportion | 5% | |
| 46 | Mutyaba et al. 2015 [131] | Ecological | 12,263 | Availability of ART decreased the incidence of stomach cancer. | Proportion | 13% | |
| 47 | Menon et al. 2017 [132] | Case -control | 449 cases and 282 controls | HIV-positive patients were less likely to present for care at an advanced stage. | OR | 0.53(0.30 to 0.94) |
[i] * OR = odds ratio, aOR = adjusted odds ratio, CI = confidence interval, KSHV = Kaposi’s sarcoma associated herpesvirus, PR = prevalence rate, aPR = adjusted prevalence ratio, GIM = gastro-intestinal malignancies. PAF = population attributable fraction, Pca = prostate cancer, ART = anti-retroviral therapy, + = Positive, – = Negative.
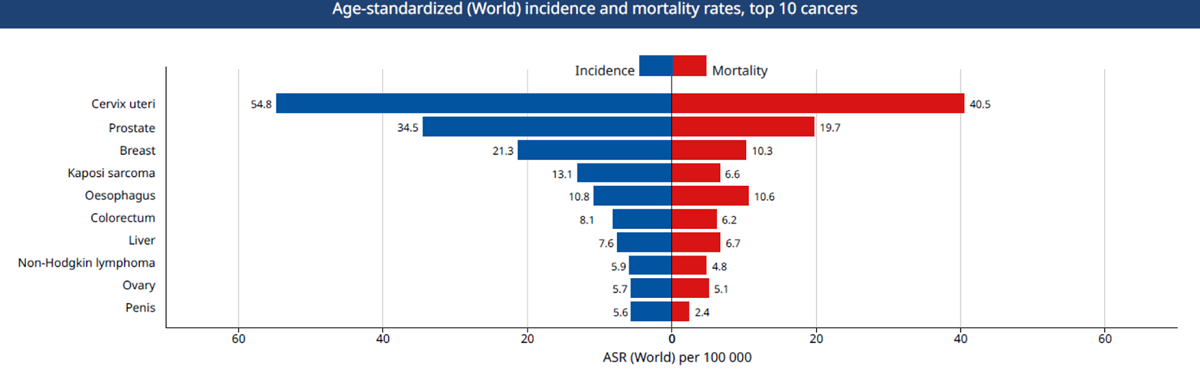
Figure 1
Top 10 causes of cancer mortality in Uganda. Source: Globocan 2018, IARC.

Figure 2
PRISMA Flow chart of cancer risk and prevention studies.