
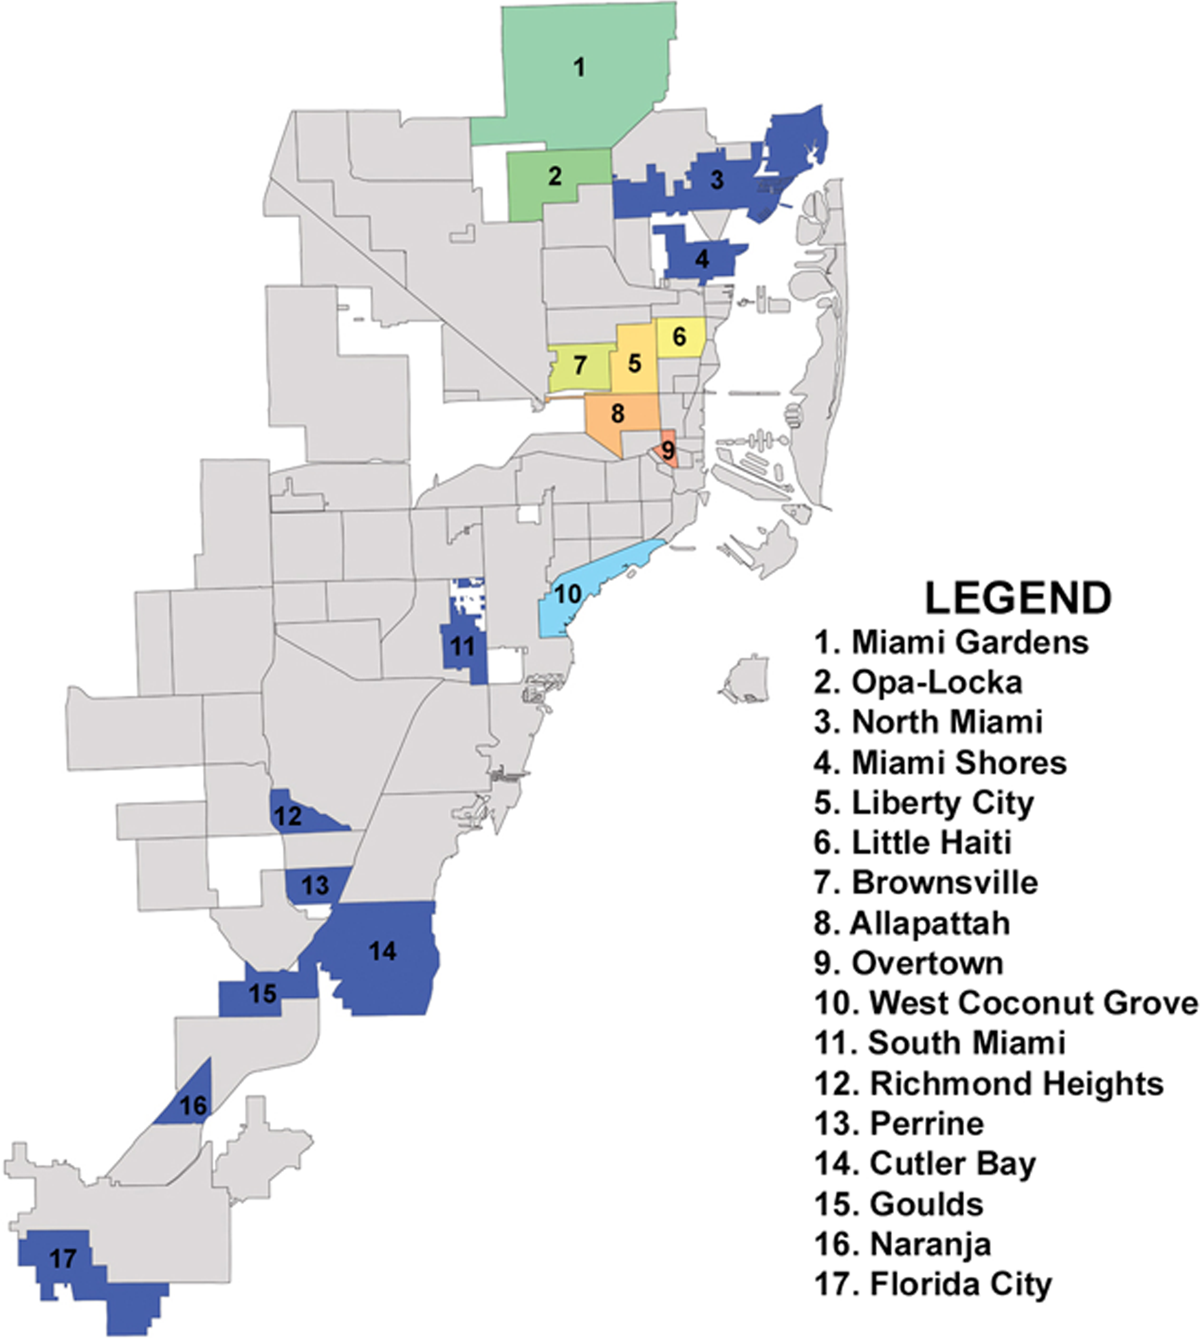
Miami’s Black neighborhoods are spread throughout the length of the county. Colors correspond to neighborhoods represented by the issue’s authors, while navy represents other Black Miami neighborhoods. Map courtesy of Germane Barnes.
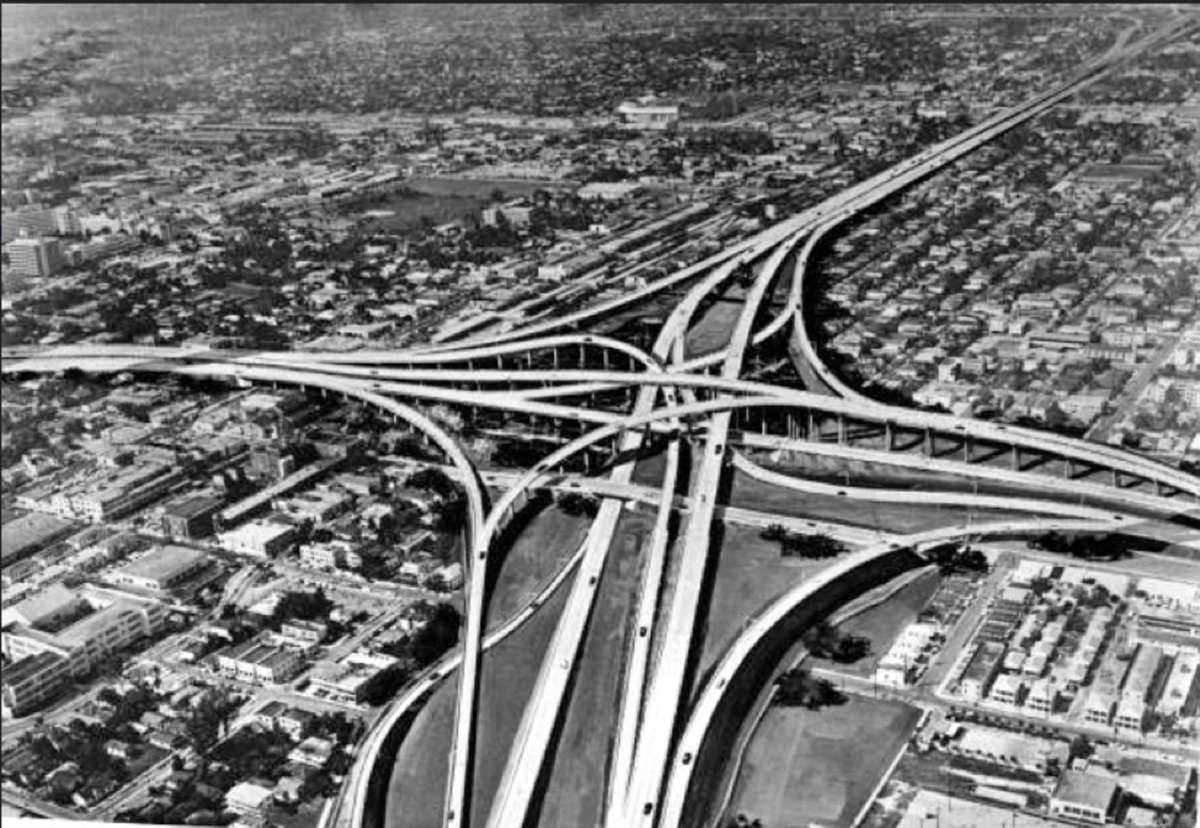
The massive interchange that decimated Overtown. Photo circa 1960.
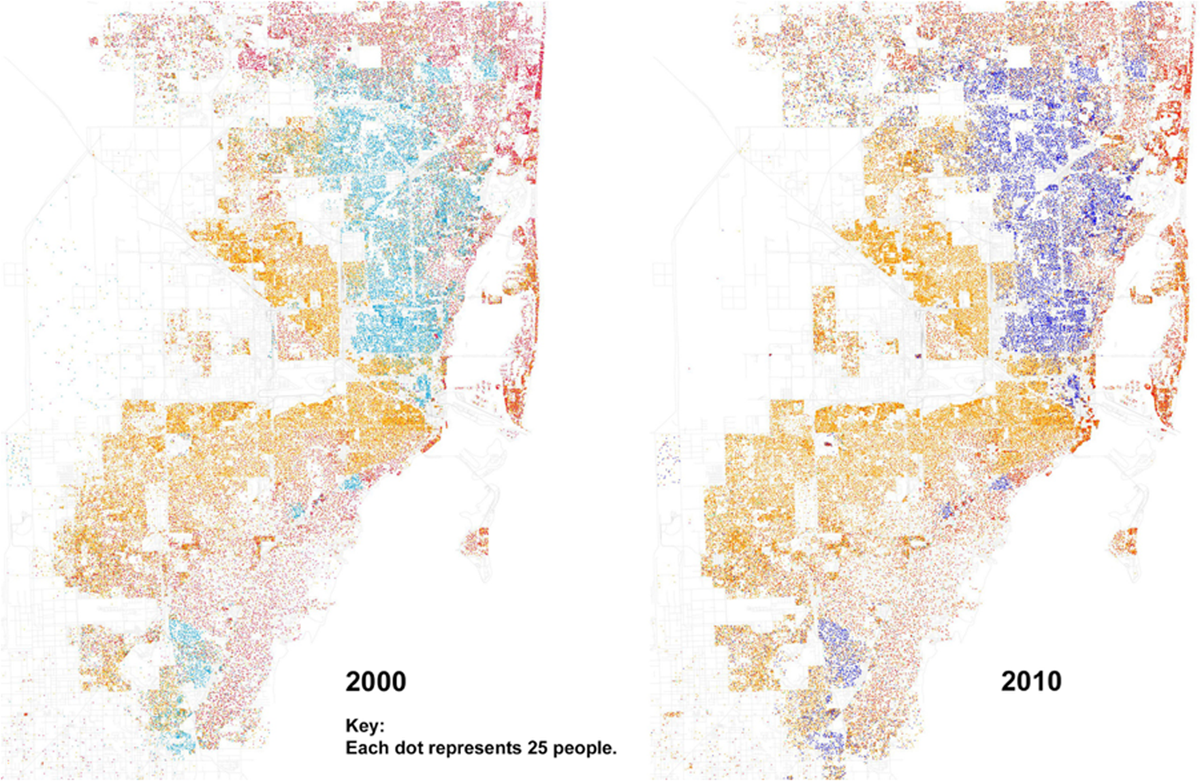
These maps capture the population density and changing racial divides in Miami from 2000 to 2010. The data is pulled from United States Census; thus, races are self-identified. Key: Red—White; Blue/Teal—Black; Orange—Hispanic; Green—Asian; Gray—Other. The maps visually illustrate the concentration of Black Miami in just a few neighborhoods. Maps created by Eric Fischer.