
Figure 1.
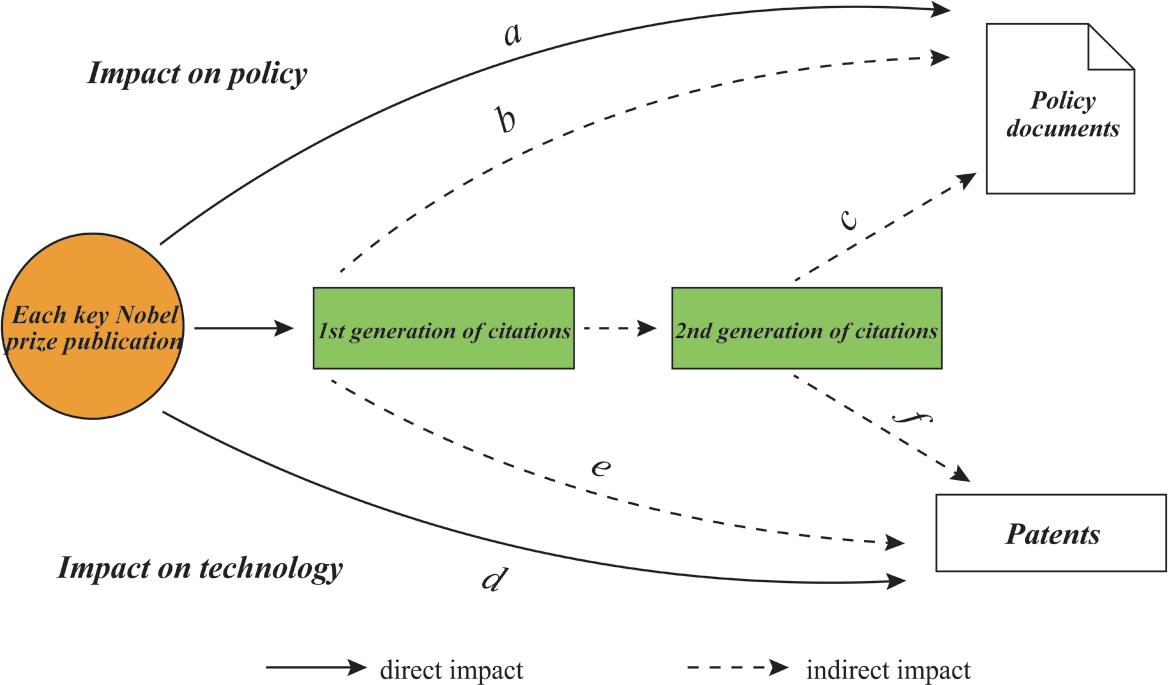
Figure 2.

Figure 3.
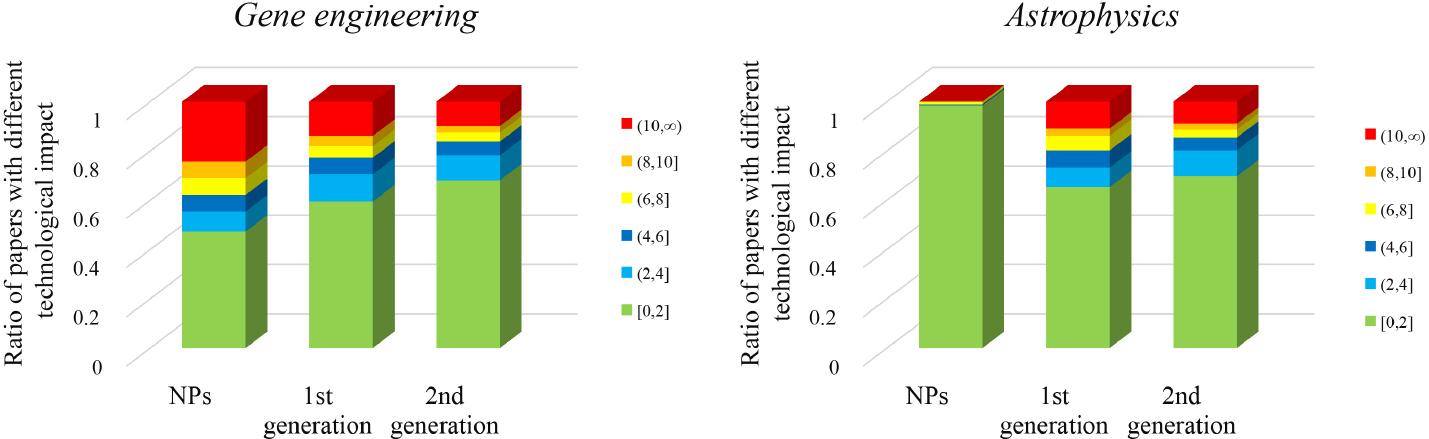
Figure 4.
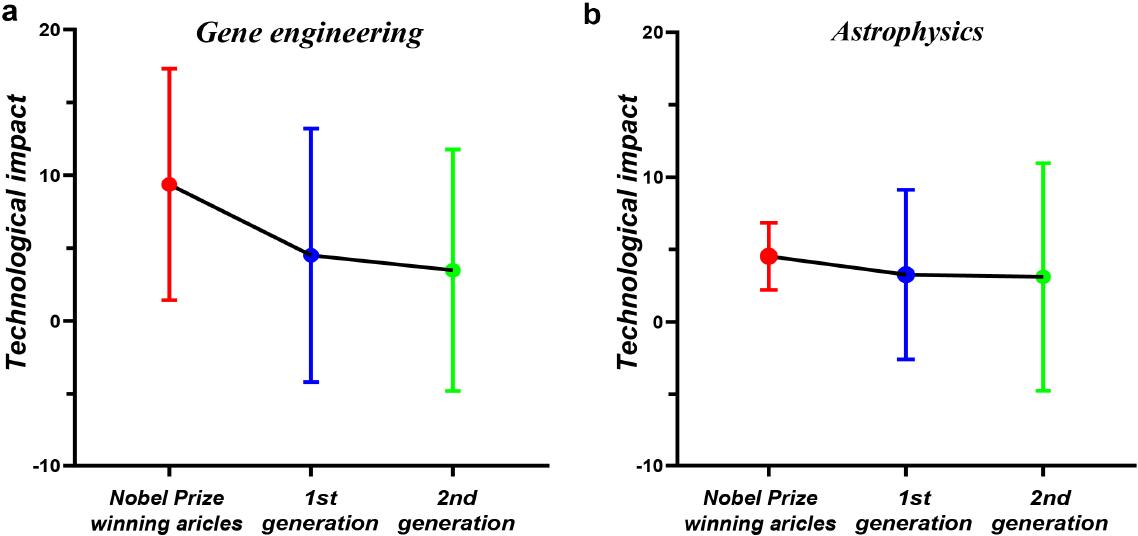
Figure 5.
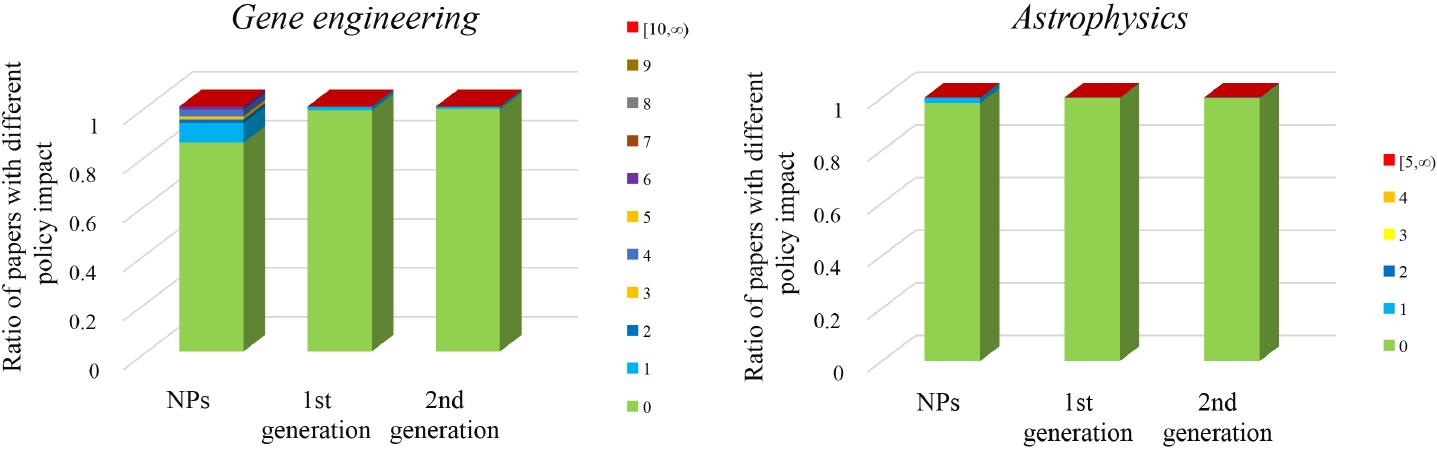
Figure 6.
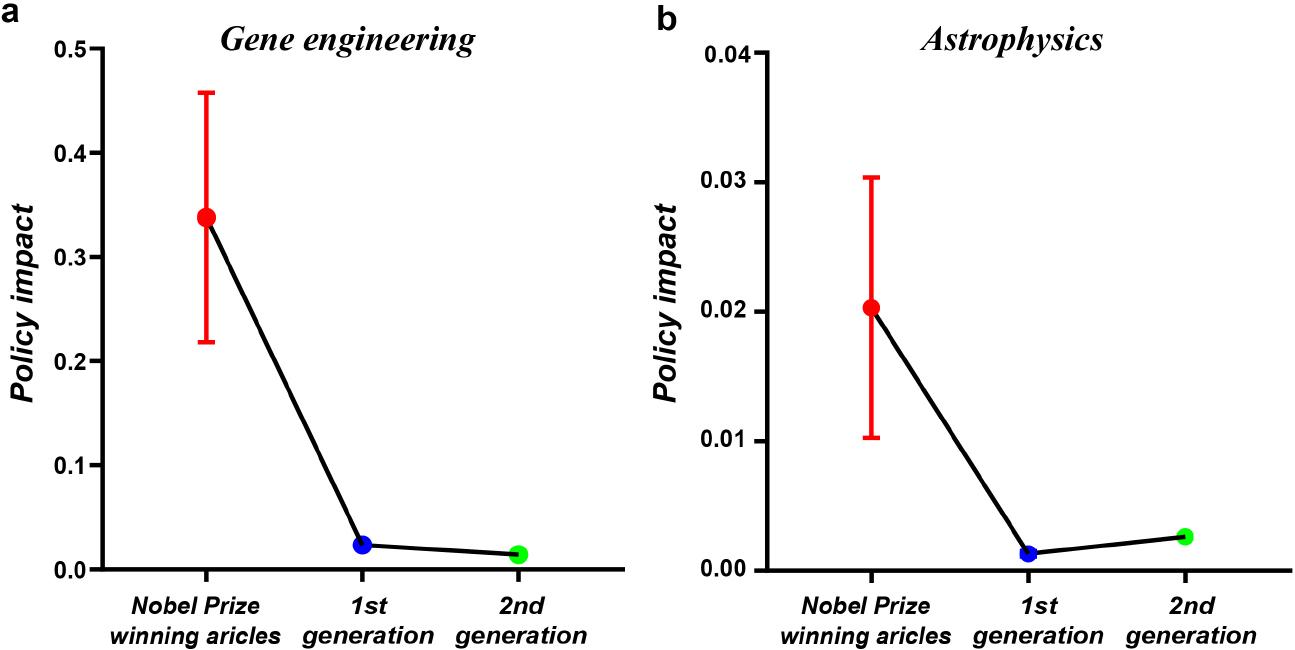
The descriptive statistical of policy documents citing NPs and their generations of citations_
| Gene engineering | Astrophysics | |||||
|---|---|---|---|---|---|---|
| NPs | 1st generation | 2nd generation | NPs | 1st generation | 2nd generation | |
| Publication year | [1968,2017] | [1965,2021] | [1966,2021] | [1980,2016] | [1964,2021] | [1958,2021] |
| Number of countries (Gini) | 4 (0.5808) | 10 (0.7920) | 19 (0.6697) | 1 (1) | 6 (0.5490) | 17 (0.6968) |
| Number of organizations (Gini) | 6 (0.5704) | 28 (0.7525) | 78 (0.6650) | 1 (1) | 11 (0.5512) | 56 (0.7269) |
| Number of organization types (Gini) | 3 (0.6016) | 3 (0.8268) | 3 (0.6646) | 1 (1) | 3 (0.6363) | 3 (0.7575) |
| Number of categories (Gini) | 7 (0.8136) | 17 (0.8950) | 22 (0.7602) | 1 (1) | 11 (0.7397) | 19 (0.8435) |
Linear regression models of direct and indirect impact on technology_
| Gene engineering | |||||||
|---|---|---|---|---|---|---|---|
| (1) | (2) | (3) | (4) | (5) | (6) | (7) | |
| 1st generation vs NPs | −4.859*** (1.218) | −4.798*** (1.218) | −4.859*** (1.218) | −4.697*** (1.217) | −4.633*** (1.216) | −2.227* (1.175) | −2.587** (1.168) |
| 2nd generation vs NPs | −5.882*** (1.212) | −5.816*** (1.212) | −5.881*** (1.212) | −5.725*** (1.211) | −5.626*** (1.210) | −3.423*** (1.169) | −3.817*** (1.162) |
| N-publication citations | 1.040−4*** (3.100−5) | 1.050−4*** (3.000−5) | |||||
| N-categories | −0.011 (0.073) | 0.065 (0.070) | |||||
| Time lag | 0.023*** (0.002) | −0.211*** (0.006) | |||||
| N-references | −0.008*** (4.070−4) | −0.001*** (1.116−3) | |||||
| Publication age | 0.232*** (0.003) | 0.324*** (0.004) | |||||
| Constant | 9.373 | 9.286 | 9.384 | 9.048 | 9.601 | 2.282 | 2.337 |
| R2 | 0.031 | 0.033 | 0.031 | 0.052 | 0.072 | 0.266 | 0.288 |
| N | 883,944 | 883,944 | 883,944 | 883,944 | 883,944 | 883,944 | 883,944 |
| Astrophysics | |||||||
| (8) | (9) | (10) | (11) | (12) | (13) | (14) | |
| 1st generation vs NPs | −1.263 (3.949) | −1.264 (3.949) | −0.809 (3.949) | −0.624 (3.916) | −1.164 (3.948) | 1.020 (3.777) | 1.303 (3.757) |
| 2nd generation vs NPs | −1.422 (3.878) | −1.411 (3.878) | −0.922 (3.879) | −0.665 (3.846) | −1.344 (3.877) | 1.509 (3.712) | 1.955 (3.693) |
| N-publication citations | −3.360−4 (3.170−4) | −4.457−5 (3.150−4) | |||||
| N-categories | 0.705** (0.313) | 0.332 (0.300) | |||||
| Time lag | 0.149*** (0.028) | −0.177*** (0.039) | |||||
| N-references | −0.003 (0.002) | 0.002 (0.002) | |||||
| Publication age | 0.197*** (0.016) | 0.276*** (0.023) | |||||
| Constant | 4.531 | 4.596 | 3.121 | 2.813 | 4.603 | −2.116 | −3.459 |
| R2 | 0.010 | 0.029 | 0.058 | 0.135 | 0.039 | 0.297 | 0.320 |
| N | 472,534 | 472,534 | 472,534 | 472,534 | 472,534 | 472,534 | 472,534 |
Descriptive statistics of NPs and their generations of citations_
| Gene engineering | Astrophysics | |||||
|---|---|---|---|---|---|---|
| NPs | 1st generation | 2nd generation | NPs | 1st generation | 2nd generation | |
| # Publications | 74 | 29,687 | 854,183 | 197 | 49,497 | 422,840 |
| # Publications cited by patents | 47 | 4,280 | 81,737 | 4 | 101 | 1,462 |
| % Publications cited by patents | 63.51% | 14.42% | 9.57% | 2.03% | 0.20% | 0.35% |
| Average number of patent citations | 130.40 | 103.80 | 106.78 | 1.5 | 2.75 | 6.70 |
| Average number of citing IPC groups | 7.10 | 4.77 | 4.37 | 3 | 3.31 | 3.41 |
| # Publications cited by policies | 11 | 500 | 9,008 | 4 | 51 | 745 |
| % Publications cited by policies | 14.86% | 1.68% | 1.05% | 2.03% | 0.10% | 0.18% |
| Average number of policy citations | 2.27 | 1.39 | 1.34 | 1 | 1.25 | 1.49 |
The VIFs of variables for policy impact_
| Variables | Gene engineering | Astrophysics |
|---|---|---|
| independent variable (groups) | 1.002 | 1.069 |
| Publication-type | 1.079 | 1.094 |
| N-research countries | 1.034 | 1.091 |
| N-publication citations | 1.003 | 1.074 |
| N-references | 1.093 | 1.116 |
| Publication age | 1.069 | 1.098 |
The VIFs of variables for technological impact_
| Variables | Gene engineering | Astrophysics |
|---|---|---|
| independent variable (groups) | 1.001 | 1.011 |
| N-categories | 1.000 | 1.017 |
| N-publication citations | 1.010 | 1.094 |
| Time lag | 1.976 | 2.107 |
| N-references | 1.050 | 1.128 |
| Publication age | 2.024 | 2.191 |
Negative binomial regression models of direct and indirect impact on policy_
| Gene engineering | |||||||
|---|---|---|---|---|---|---|---|
| (1) | (2) | (3) | (4) | (5) | (6) | (7) | |
| 1st generation vs NPs | −0.490** (0.204) | −0.491** (0.204) | −0.476** (0.204) | −0.469** (0.204) | −0.497** (0.204) | −0.466** (0.204) | −0.428** (0.204) |
| 2nd generation vs NPs | −0.530*** (0.200) | −0.530*** (0.200) | −0.519*** (0.200) | −0.506** (0.200) | −0.537*** (0.200) | −0.507** (0.201) | −0.473** (0.201) |
| Publication-type | 0.001 (0.009) | −1.378−3 (9.233−3) | |||||
| N-research countries | 0.036*** (0.006) | 3.880−2*** (6.193−3) | |||||
| N-publication citations | 1.261−5*** (9.80−7) | 1.236−5*** (9.902−7) | |||||
| N-references | 1.626−4** (7.578−5) | 1.676−4** (7.857−5) | |||||
| Publication age | 0.002** (0.001) | 2.307−3*** (7.958−4) | |||||
| Constant | 0.821 | 0.820 | 0.757 | 0.792 | 0.816 | 0.765 | 0.640 |
| Log-likelihood | −12402.77 | −12402.77 | −12387.26 | −12362.29 | −12400.58 | −12400.51 | −12340.97 |
| N | 883,944 | 883,944 | 883,944 | 883,944 | 883,944 | 883,944 | 883,944 |
| Astrophysics | |||||||
| (8) | (9) | (10) | (11) | (12) | (13) | (14) | |
| 1st generation vs NPs | 0.227 (0.525) | 0.210 (0.525) | 0.231 (0.525) | 0.479 (0.543) | 0.227 (0.525) | 0.261 (0.525) | 0.479 (0.542) |
| 2nd generation vs NPs | 0.397 (0.510) | 0.384 (0.510) | 0.404 (0.510) | 0.671 (0.532) | 0.397 (0.510) | 0.450 (0.510) | 0.695 (0.531) |
| Publication-type | −0.032 (0.032) | −2.993−2 (3.394−2) | |||||
| N-research countries | 0.006 (0.013) | 7.768−3 (1.383−2) | |||||
| N-publication citations | 4.366−5** (2.214−5) | 4.085-5* (2.246−5) | |||||
| N-references | −1.721−5 (2.408−4) | 9.576−5 (2.546−4) | |||||
| Publication age | 0.004* (0.002) | 3.768−3* (2.121−3) | |||||
| Constant | 1.155−13 | 0.056 | −0.018 | −0.288 | 8.214−4 | −0.137 | −0.377 |
| Log-likelihood | −1143.06 | −1142.54 | −1142.96 | −1141.34 | −1143.06 | −1141.43 | −1139.20 |
| N | 472,534 | 472,534 | 472,534 | 472,534 | 472,534 | 472,534 | 472,534 |