
Figure 1.
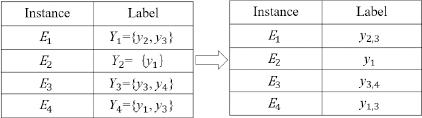
Figure 2.
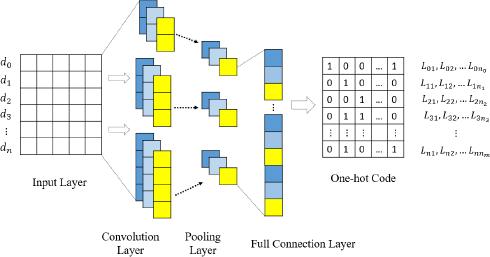
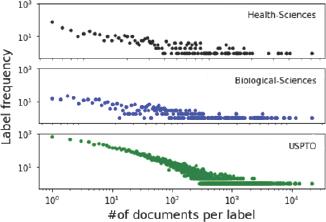
Figure 3.
Performance of the dependency-LDA model with different parameter settings on three real-world datasets_
| Dataset | #of topics | βC | Macro F1 | Micro F1 | Hamming loss |
|---|---|---|---|---|---|
| Biological-Sciences | 20 | 0.18 | 0.0443 | 0.0101 | 0.2537 |
| 50 | 0.07 | 0.0438 | 0.0102 | 0.2540 | |
| 100 | 0.04 | 0.0436 | 0.0096 | 0.2544 | |
| Health-Sciences | 20 | 0.47 | 0.0412 | 0.0100 | 0.2542 |
| 50 | 0.19 | 0.0410 | 0.0102 | 0.2590 | |
| 100 | 0.09 | 0.0386 | 0.0102 | 0.2603 | |
| USPTO | 50 | 0.40 | 0.0023 | 0.0010 | 0.1274 |
| 100 | 0.20 | 0.0022 | 0.0012 | 0.1316 | |
| 200 | 0.10 | 0.0022 | 0.0012 | 0.1343 | |
| 400 | 0.05 | 0.0026 | 0.0010 | 0.0895 |
The number of instances in the training and test sets of our datasets_
| Datasets | Training Set | Test Set |
|---|---|---|
| Health-Sciences | 16,932 | 4,236 |
| Biological-Sciences | 9,034 | 2,258 |
| USPTO | 283,899 | 71,622 |
Performance of the TextCNN, TextRNN and TextRCNN with different parameter settings on three real-world datasets_
| Datasets | Top_k | Model | Macro F1 | Micro F1 | Hamming loss |
|---|---|---|---|---|---|
| Health-Sciences | 7 | TextCNN | 0.0883 | 0.2489 | 0.2304 |
| TextRNN | 0.0788 | 0.2341 | 0.1256 | ||
| TextRCNN | 0.0836 | 0.2294 | 0.1359 | ||
| Biological-Sciences | 4 | TextCNN | 0.3070 | 0.4693 | 0.5055 |
| TextRNN | 0.2026 | 0.4202 | 0.2548 | ||
| TextRCNN | 0.3114 | 0.5094 | 0.4714 | ||
| USPTO | 65 | TextCNN | 0.0341 | 0.2018 | 0.0127 |
| TextRNN | 0.0301 | 0.2437 | 0.0107 | ||
| TextRCNN | 0.0401 | 0.2408 | 0.0089 |
Characteristics of our datasets and benchmark datasets_
| Dataset | #of instances | #of labels | #of hierarchies | Label cardinality | doc/label | ||
|---|---|---|---|---|---|---|---|
| Avg. | Max. | Min. | |||||
| Health-Sciences | 21,168 | 507 | 5 | 2.25 | 94.10 | 1,571 | 1 |
| Biological-Sciences | 11,292 | 484 | 6 | 1.56 | 36.29 | 606 | 1 |
| USPTO | 355,058 | 8,867 | 4 | 4.08 | 152.38 | 20,988 | 1 |
| Emotions | 593 | 6 | 1 | 1.869 | 184.67 | 264 | 148 |
| Scene | 2,407 | 6 | 1 | 1.074 | 430.83 | 533 | 364 |
| Bibtex | 7,395 | 159 | 1 | 2.401 | 112 | 1,042 | 51 |
| Medical | 978 | 45 | 1 | 1.25 | 27 | 266 | 1 |
Several open-source toolkits for solving multi-label classification problems_
| Name | Link |
|---|---|
| Dependency LDA | https://github.com/timothyrubin/DependencyLDA |
| Scikit-Multilearn | http://scikit.ml/index.html |
| Magpie | https://github.com/inspirehep/magpie |
| Hierarchical Text Multi Label Classification | https://github.com/RunlongYu/Hierarchical-Text-Multi-Label-Classificaiton |
| Keras-TextClassification | https://github.com/yongzhuo/Keras-TextClassification |
| Neural Classifier | https://github.com/Tencent/NeuralNLP-NeuralClassifier |
Performance of seven multi-label classification methods on three real-world datasets_
| Dataset | Method | Macro F1 | Micro F1 | Hamming Loss |
|---|---|---|---|---|
| Biological-Sciences | Dependency LDA | 0.0443 | 0.0102 | 0.2537 |
| MLkNN | 0.0836 | 0.1535 | 0.3389 | |
| RAkEL | 0.0280 | 0.0794 | 0.2859 | |
| LabelPowerset | 0.0044 | 0.0219 | 0.3845 | |
| TextCNN | 0.3070 | 0.4693 | 0.5055 | |
| TextRNN | 0.2026 | 0.4202 | 0.2548 | |
| TextRCNN | 0.3114 | 0.5094 | 0.4714 | |
| Health-Sciences | dependency LDA | 0.0412 | 0.0102 | 0.2542 |
| MLkNN | 0.0806 | 0.1364 | 0.2727 | |
| RAkEL | 0.0294 | 0.0928 | 0.1761 | |
| LabelPowerset | 0.0066 | 0.0620 | 0.3113 | |
| TextCNN | 0.0883 | 0.2489 | 0.2304 | |
| TextRNN | 0.0788 | 0.2341 | 0.1256 | |
| TextRCNN | 0.0836 | 0.2294 | 0.1359 | |
| USPTO | dependency LDA | 0.0026 | 0.0012 | 0.0895 |
| MLkNN | 0.1152 | 0.2692 | 0.0618 | |
| RAkEL | 0.0423 | 0.1102 | 0.0587 | |
| LabelPowerset | 0.0274 | 0.1161 | 0.0594 | |
| TextCNN | 0.0341 | 0.2018 | 0.0127 | |
| TextRNN | 0.0301 | 0.2437 | 0.0107 | |
| TextRCNN | 0.0401 | 0.2408 | 0.0089 |
Performance of the MLkNN, RAkEL, and LabelPowerset methods with different parameter settings on three real-world datasets_
| Dataset | Method | Max-features | Macro F1 | Micro F1 | Hamming Loss |
|---|---|---|---|---|---|
| Biological-Sciences | MLkNN | 800 | 0.0831 | 0.1535 | 0.3389 |
| 1,000 | 0.0836 | 0.1532 | 0.3404 | ||
| RAkEL | 800 | 0.0280 | 0.0794 | 0.2859 | |
| 1,000 | 0.0229 | 0.0637 | 0.2923 | ||
| LabelPowerset | 800 | 0.0044 | 0.0219 | 0.3845 | |
| 1,000 | 0.0042 | 0.0195 | 0.3850 | ||
| Health-Sciences | MLkNN | 800 | 0.0738 | 0.1364 | 0.2727 |
| 1,000 | 0.0806 | 0.1242 | 0.2759 | ||
| RAkEL | 800 | 0.0284 | 0.0858 | 0.1761 | |
| 1,000 | 0.0294 | 0.0928 | 0.1844 | ||
| LabelPowerset | 800 | 0.0062 | 0.0610 | 0.3115 | |
| 1,000 | 0.0066 | 0.0620 | 0.3113 | ||
| USPTO | MLkNN | 12,000 | 0.1142 | 0.2692 | 0.0643 |
| 18,000 | 0.1152 | 0.2673 | 0.0618 | ||
| RAkEL | 12,000 | 0.0421 | 0.1038 | 0.0588 | |
| 18,000 | 0.0423 | 0.1102 | 0.0587 | ||
| LabelPowerset | 12,000 | 0.0273 | 0.1161 | 0.0594 | |
| 18,000 | 0.0274 | 0.1151 | 0.0624 |
The number of word tokens and unique words in our datasets_
| Datasets | #of word tokens | #of unique words |
|---|---|---|
| Health-Sciences | 1,556,854 | 64,113 |
| Biological-Sciences | 1,486,840 | 45,610 |
| USPTO | 2,540,118 | 81,268 |
Spearman correlation coefficients among Macro F1, Micro F1, and Hamming Loss_
| Macro F1 | Micro F1 | Hamming loss | |
|---|---|---|---|
| Macro F1 | 1.000 | 0.762 | 0.277 |
| Micro F1 | 0.762 | 1.000 | -0.008 |
| Hamming loss | 0.277 | -0.008 | 1.000 |