
Figure 1.
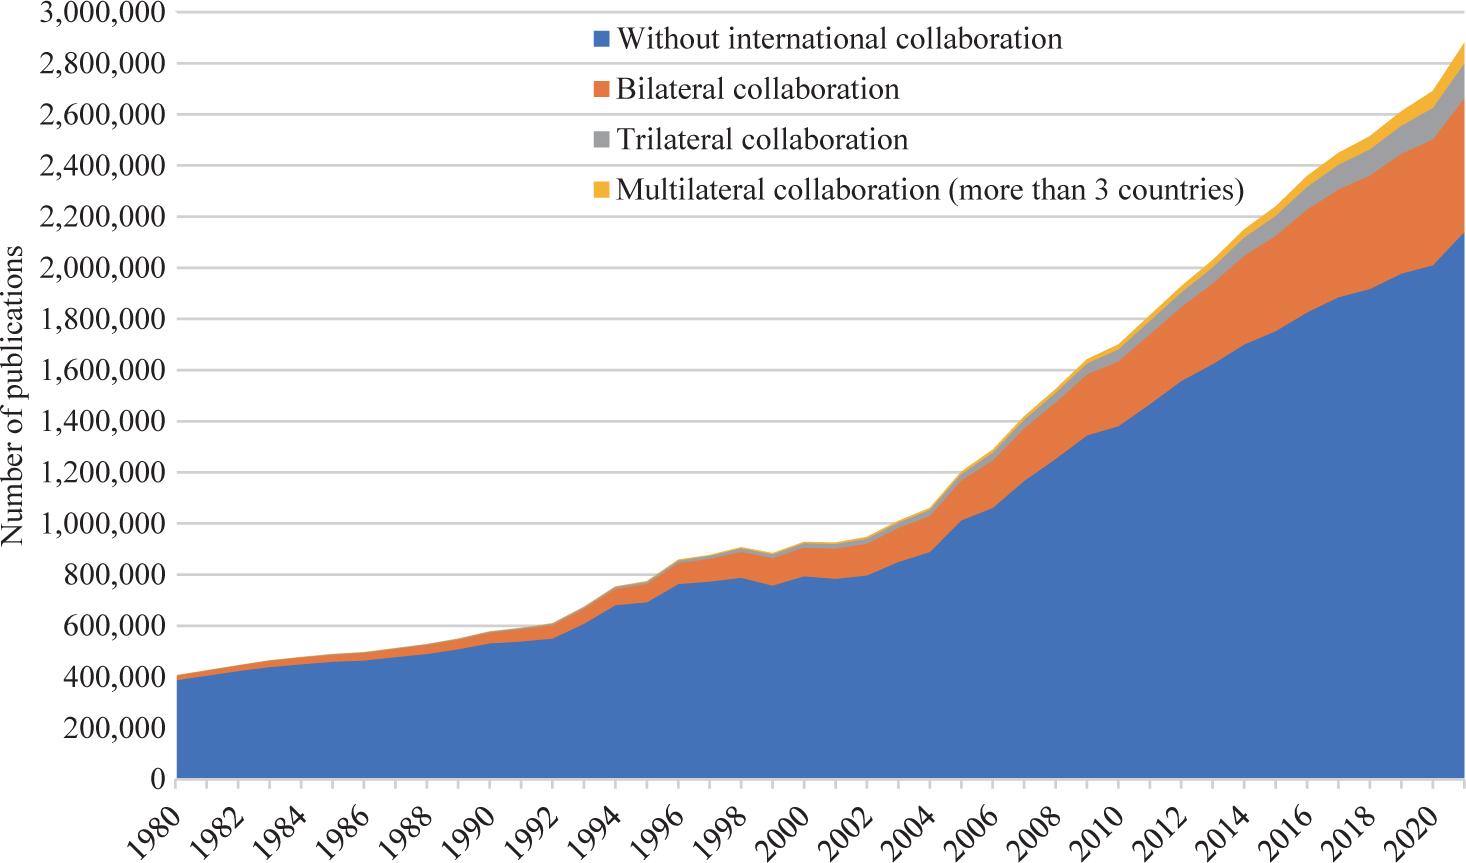
Figure 2.
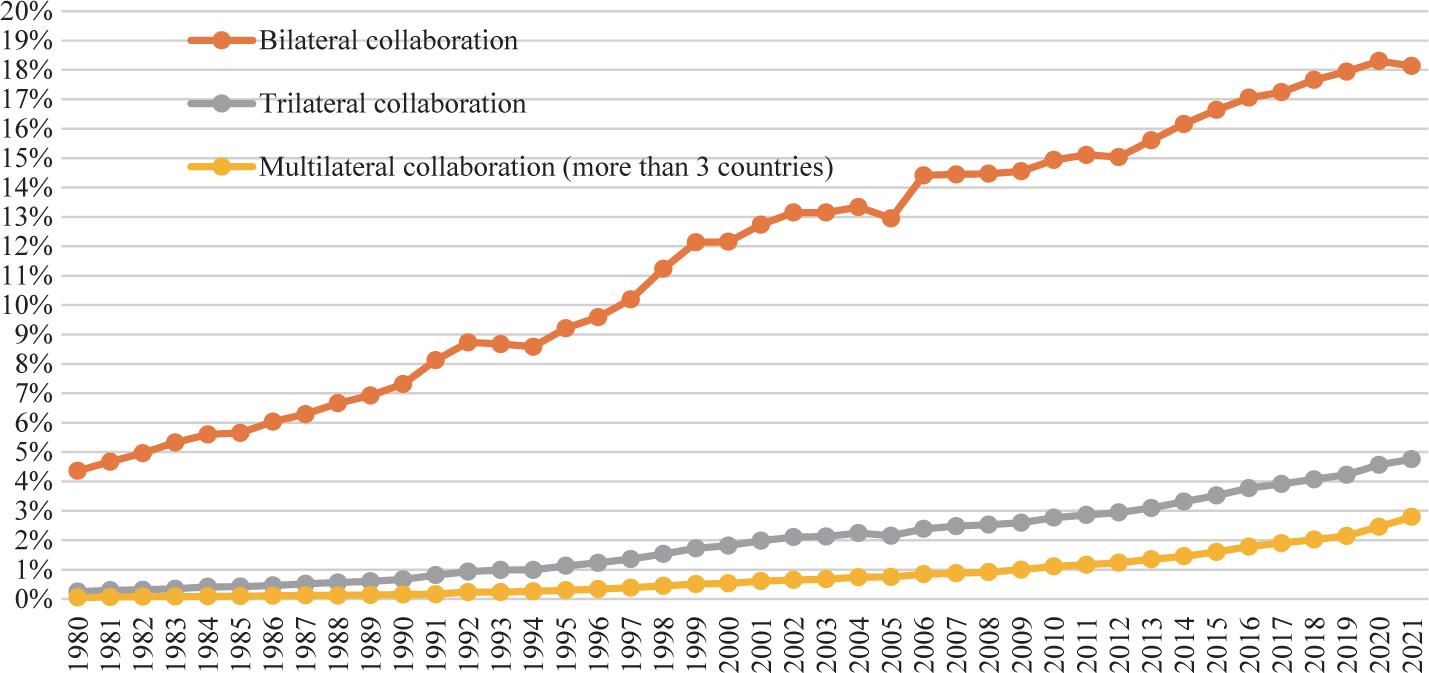
Figure 3.
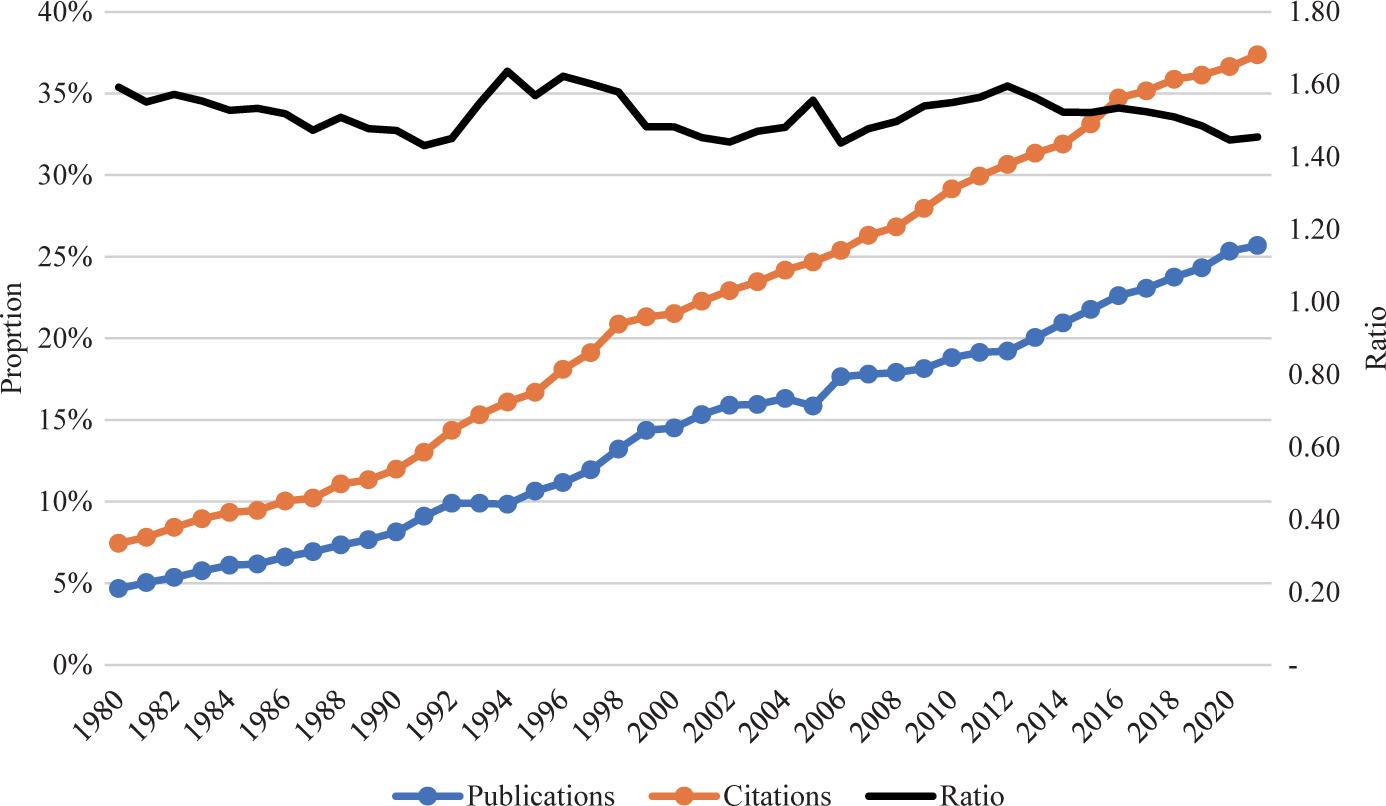
Figure 4.

Figure 5.
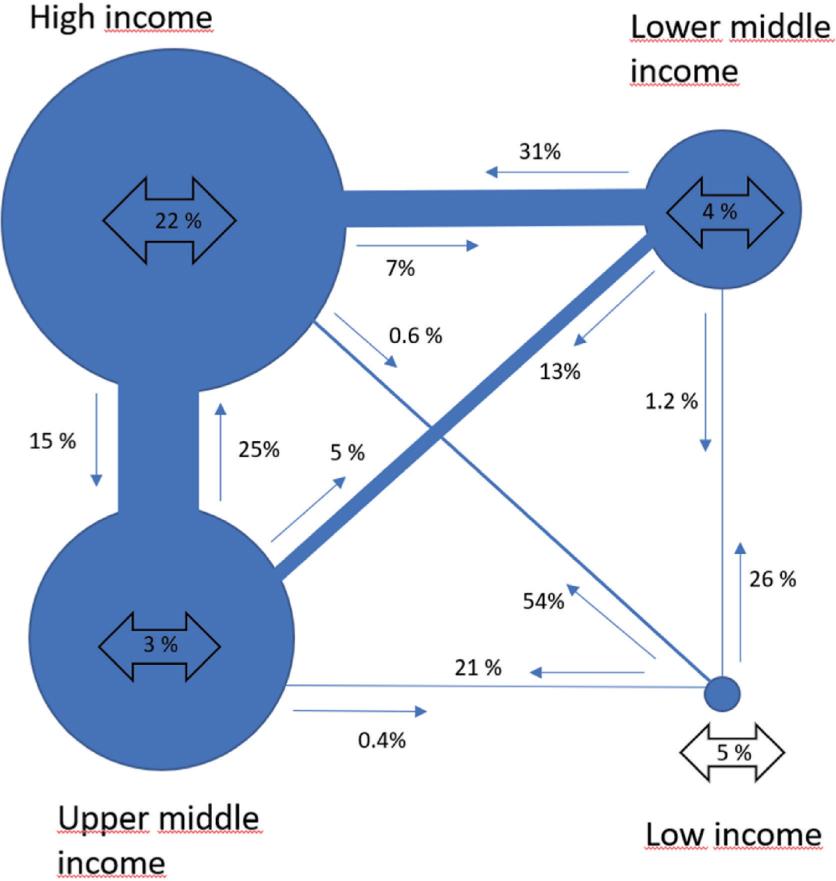
Average proportion of international collaboration by country income groups, 2020-2021_
| Country group | Number of countries/regions | Average rate of international collaboration (weighted) |
|---|---|---|
| Low income | 27 | 74% |
| Lower middle income | 55 | 42% |
| Upper middle income | 54 | 33% |
| High income | 72 | 54% |
Proportion of publications involving international collaboration by country/region_* Five-year time-periods (1981-2020) and most recent two-year period (2020-2021)
| 1981-1985 | 1986-1990 | 1991-1995 | 1996-2000 | 2001-2005 | 2006-2010 | 2011-2015 | 2016-2020 | 2020-2021 | Overall change (pct. Points) | |
|---|---|---|---|---|---|---|---|---|---|---|
| Switzerland | 25 % | 32 % | 37 % | 44 % | 52 % | 61 % | 66 % | 73 % | 75 % | 50 |
| Saudi Arabia | 24 % | 16 % | 16 % | 22 % | 33 % | 46 % | 72 % | 75 % | 75 % | 51 |
| Belgium | 22 % | 28 % | 34 % | 41 % | 48 % | 55 % | 62 % | 70 % | 73 % | 51 |
| Sweden | 19 % | 24 % | 30 % | 37 % | 44 % | 52 % | 58 % | 66 % | 70 % | 51 |
| Denmark | 22 % | 26 % | 33 % | 43 % | 48 % | 55 % | 58 % | 66 % | 70 % | 48 |
| Netherlands | 17 % | 21 % | 26 % | 35 % | 42 % | 49 % | 56 % | 65 % | 68 % | 51 |
| UK | 13 % | 16 % | 21 % | 28 % | 36 % | 42 % | 50 % | 60 % | 65 % | 52 |
| France | 15 % | 19 % | 25 % | 32 % | 39 % | 46 % | 52 % | 61 % | 63 % | 48 |
| Pakistan | 26 % | 27 % | 27 % | 33 % | 33 % | 32 % | 42 % | 53 % | 63 % | 37 |
| Australia | 13 % | 16 % | 20 % | 27 % | 35 % | 40 % | 47 % | 58 % | 62 % | 49 |
| Egypt | 18 % | 20 % | 22 % | 27 % | 31 % | 38 % | 49 % | 54 % | 61 % | 43 |
| Canada | 16 % | 19 % | 23 % | 30 % | 36 % | 41 % | 47 % | 55 % | 59 % | 43 |
| South Africa | 12 % | 13 % | 17 % | 28 % | 38 % | 40 % | 46 % | 53 % | 59 % | 47 |
| Germany** | 11 % | 18 % | 24 % | 30 % | 38 % | 44 % | 49 % | 55 % | 58 % | 47 |
| Portugal | 37 % | 35 % | 37 % | 39 % | 43 % | 46 % | 48 % | 55 % | 58 % | 21 |
| Malaysia | 26 % | 33 % | 32 % | 36 % | 35 % | 32 % | 35 % | 45 % | 56 % | 30 |
| Spain | 10 % | 17 % | 25 % | 29 % | 33 % | 36 % | 43 % | 50 % | 52 % | 42 |
| Italy | 17 % | 22 % | 25 % | 30 % | 33 % | 39 % | 43 % | 50 % | 51 % | 34 |
| Taiwan, China | 23 % | 17 % | 16 % | 15 % | 16 % | 19 % | 24 % | 37 % | 44 % | 21 |
| Mexico | 26 % | 27 % | 31 % | 35 % | 38 % | 39 % | 39 % | 42 % | 44 % | 18 |
| USA | 7 % | 9 % | 12 % | 17 % | 21 % | 27 % | 32 % | 39 % | 41 % | 34 |
| Poland | 17 % | 24 % | 34 % | 35 % | 35 % | 31 % | 29 % | 34 % | 38 % | 21 |
| Brazil | 20 % | 24 % | 30 % | 30 % | 28 % | 24 % | 27 % | 34 % | 36 % | 16 |
| Japan | 6 % | 8 % | 11 % | 14 % | 18 % | 23 % | 27 % | 32 % | 34 % | 28 |
| Iran | 31 % | 32 % | 29 % | 24 % | 21 % | 19 % | 20 % | 26 % | 34 % | 3 |
| South Korea | 32 % | 28 % | 25 % | 20 % | 22 % | 24 % | 27 % | 30 % | 33 % | 1 |
| Russia*** | 5 % | 4 % | 15 % | 25 % | 31 % | 30 % | 28 % | 26 % | 30 % | 25 |
| China | 17 % | 19 % | 21 % | 20 % | 18 % | 18 % | 20 % | 25 % | 26 % | 9 |
| India | 6 % | 8 % | 11 % | 14 % | 18 % | 19 % | 18 % | 21 % | 26 % | 20 |
| Turkey | 27 % | 20 % | 20 % | 18 % | 17 % | 16 % | 18 % | 23 % | 26 % | -1 |
Proportion of publications involving international collaboration by WoS-categories_* Five-year time-periods (1981-2020) and the most recent two-year period (2020-2021)
| 1981-1985 | 1986-1990 | 1991-1995 | 1996-2000 | 2001-2005 | 2006-2010 | 2011-2015 | 2016-2020 | 2020-2021 | Overall change (pct. points)** | |
|---|---|---|---|---|---|---|---|---|---|---|
| Astronomy & Astrophysics | 18 % | 21 % | 25 % | 29 % | 32 % | 42 % | 46 % | 52 % | 53 % | 35 |
| Evolutionary Biology | 10 % | 12 % | 16 % | 24 % | 33 % | 38 % | 43 % | 49 % | 50 % | 40 |
| Palaeontology | 12 % | 12 % | 16 % | 25 % | 32 % | 39 % | 44 % | 48 % | 50 % | 38 |
| Tropical Medicine | 17 % | 23 % | 31 % | 37 % | 43 % | 42 % | 44 % | 47 % | 48 % | 31 |
| Parasitology | 10 % | 14 % | 20 % | 27 % | 31 % | 34 % | 40 % | 45 % | 43 % | 33 |
| Physics, Particles & Fields | 20 % | 20 % | 24 % | 27 % | 29 % | 33 % | 37 % | 42 % | 43 % | 23 |
| Ecology | 5 % | 7 % | 9 % | 16 % | 24 % | 30 % | 35 % | 39 % | 41 % | 36 |
| Biodiversity Conservation | 5 % | 6 % | 8 % | 14 % | 21 % | 29 % | 33 % | 38 % | 40 % | 35 |
| Geochemistry & Geophysics | 11 % | 14 % | 19 % | 24 % | 31 % | 34 % | 37 % | 39 % | 39 % | 28 |
| Neuroimaging | 2 % | 5 % | 6 % | 10 % | 17 % | 23 % | 30 % | 37 % | 39 % | 37 |
| Physics, Nuclear | 21 % | 21 % | 25 % | 30 % | 31 % | 32 % | 34 % | 39 % | 38 % | 17 |
| Mineralogy | 14 % | 17 % | 21 % | 26 % | 33 % | 33 % | 36 % | 39 % | 38 % | 24 |
| Geography, Physical | 8 % | 9 % | 13 % | 19 % | 27 % | 29 % | 35 % | 37 % | 38 % | 30 |
| Meteorology & Atmospheric Sci. | 6 % | 9 % | 10 % | 16 % | 24 % | 30 % | 33 % | 37 % | 38 % | 32 |
| Mycology | 7 % | 9 % | 14 % | 20 % | 25 % | 30 % | 33 % | 38 % | 37 % | 30 |
j_jdis-2023-0015_utab_001
| Article | Country A | Country B | Country C |
|---|---|---|---|
| Article 1 | X | X | X |
| Article 2 | X | ||
| Article 3 | X | ||
| Total number of articles | 1 | 2 | 2 |
| Number of internationally co-authored articles | 1 | 1 | 1 |
| Proportion of internationally co-authored articles | 100% | 50% | 50% |
Proportion of publications involving international collaboration by area of research_ Five-year time-periods (1981-2020) and most recent two-year period (2020-2021)
| 1981-1985 | 1986-1990 | 1991-1995 | 1996-2000 | 2001-2005 | 2006-2010 | 2011-2015 | 2016-2020 | 2020-2021 | Overall change (pct. points)* | |
|---|---|---|---|---|---|---|---|---|---|---|
| Biology | 6 % | 8 % | 10 % | 16 % | 22 % | 27 % | 30 % | 34 % | 35 % | 29 |
| Multidisciplinary jnls | 7 % | 8 % | 13 % | 16 % | 23 % | 26 % | 31 % | 34 % | 35 % | 28 |
| Geosciences | 8 % | 9 % | 11 % | 16 % | 22 % | 26 % | 29 % | 32 % | 33 % | 25 |
| Business stud & economics | 6 % | 8 % | 9 % | 12 % | 16 % | 17 % | 22 % | 27 % | 32 % | 26 |
| Mathematics & statistics | 10 % | 13 % | 15 % | 18 % | 21 % | 22 % | 25 % | 29 % | 30 % | 20 |
| Physics | 10 % | 12 % | 15 % | 18 % | 20 % | 24 % | 25 % | 28 % | 30 % | 20 |
| Biomedicine & molecular biosci. | 7 % | 9 % | 12 % | 16 % | 19 % | 22 % | 24 % | 26 % | 27 % | 20 |
| Agriculture, fisheries & forestry | 4 % | 6 % | 8 % | 12 % | 16 % | 19 % | 22 % | 26 % | 27 % | 23 |
| Computer & information sci. | 6 % | 8 % | 7 % | 7 % | 8 % | 14 % | 18 % | 23 % | 27 % | 21 |
| Materials science | 7 % | 8 % | 11 % | 14 % | 18 % | 19 % | 19 % | 25 % | 26 % | 19 |
| Psychology | 3 % | 4 % | 6 % | 9 % | 12 % | 16 % | 20 % | 24 % | 26 % | 23 |
| Chemistry | 6 % | 8 % | 11 % | 14 % | 17 % | 18 % | 20 % | 24 % | 25 % | 19 |
| Health sciences | 4 % | 5 % | 7 % | 10 % | 14 % | 16 % | 20 % | 23 % | 25 % | 21 |
| Engineering | 5 % | 6 % | 7 % | 8 % | 9 % | 14 % | 17 % | 22 % | 25 % | 20 |
| Clinical medicine | 4 % | 5 % | 7 % | 10 % | 14 % | 17 % | 19 % | 22 % | 22 % | 18 |
| Social sciences | 3 % | 4 % | 5 % | 6 % | 9 % | 12 % | 14 % | 18 % | 22 % | 19 |
| Humanities | 1 % | 1 % | 1 % | 2 % | 3 % | 6 % | 8 % | 10 % | 11 % | 10 |