
Figure 1.
![Illustrations of RDD. (a) The continuity framework, and (b) the local randomization framework. The figure depicts the expected outcomes conditional on the running variable Xi, denoted by E[Yi(1)│Xi=x] and E[Yi(0)│Xi=x]. τSRD and τSLR represent the causal effect using these two frameworks at the cutoff c in the window [c−Δ, c+Δ], respectively. This figure is adapted from (Cattaneo & Titiunik, 2022).](https://sciendo-parsed.s3.eu-central-1.amazonaws.com/647210d8215d2f6c89dba7f3/j_jdis-2023-0008_fig_001.jpg?X-Amz-Algorithm=AWS4-HMAC-SHA256&X-Amz-Content-Sha256=UNSIGNED-PAYLOAD&X-Amz-Credential=AKIA6AP2G7AKOUXAVR44%2F20251209%2Feu-central-1%2Fs3%2Faws4_request&X-Amz-Date=20251209T182139Z&X-Amz-Expires=3600&X-Amz-Signature=89cf9f9ce9ebc6c6286d03478c612b0448d738dc7c8e900a4046aff8d578c8c8&X-Amz-SignedHeaders=host&x-amz-checksum-mode=ENABLED&x-id=GetObject)
Figure 2.
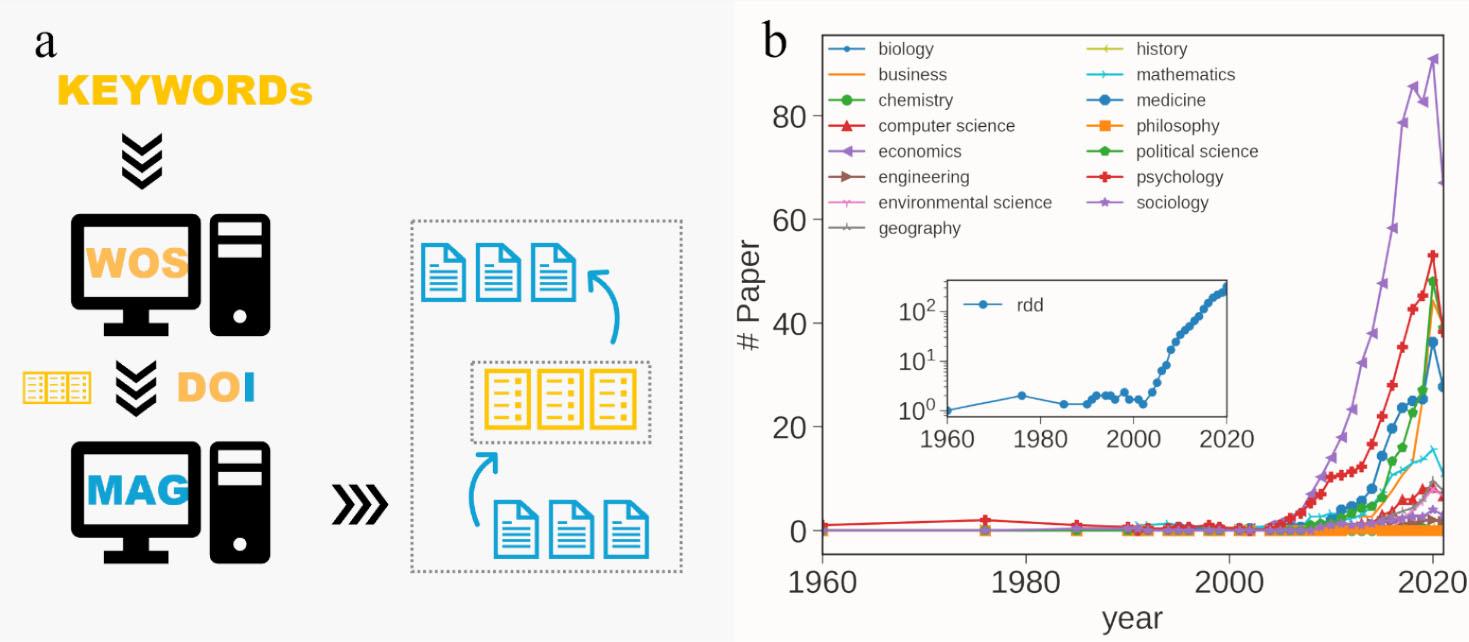
Figure 3.
Figure 4.
Figure 5.
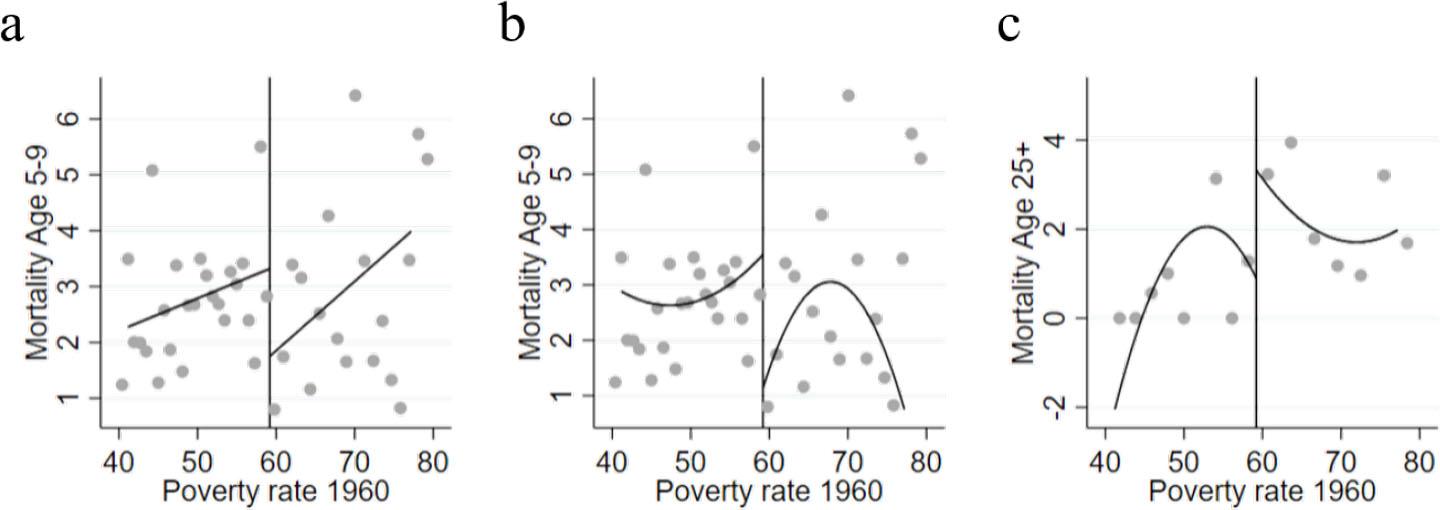
Regression discontinuity estimation of the effect of HS funding on mortality_ Robust standard errors are in parentheses,
| (1) | (2) | (3) | (4) | (5) | ||
|---|---|---|---|---|---|---|
| Variable | Mean | Nonparametric estimator | Parametric | |||
| Flexible linear | Flexible quadratic | |||||
| Bandwidth or poverty range | 9 | 18 | 36 | 8 | 16 | |
| Main results | ||||||
| Number of countries | 524 | 954 | 2,161 | 482 | 858 | |
| Mortality, Ages 5-9 (%) | 2.252 | −1.895* | −1.198* | −1.114** | −2.201** | −2.558** |
| Mortality, Ages 25+(%) | 132.626 | 2.204 | 6.016 | 5.872 | 2.091 | 2.574 |
The survey of studies that utilize RDD_ Context reveals the settings of the focal paper_ Outcome(s) means the dependent variable of the focal paper_ Treatment(s) is the treatment variable in the focal paper_ In practice, the treatment variable is a binary variable_ Running variable(s) is the forcing variable for individuals_
| Context | Outcome(s) | Treatment(s) | Running Variable(s) | |
|---|---|---|---|---|
| Economics | ||||
| Yi et al. (Yi et al., 2022) | Great Famine in China | Risk tolerance and entrepreneurship in adulthood | Experiencing early-life hardship | Location |
| García-Jimeno et al. (García-Jimeno et al., 2022) | Women’s Temperance Crusade in American | Collective action decisions | Affective information networks | Location |
| Akhtari et al. (Akhtari et al., 2022) | The politically motivated replacement of personnel in the schools in Brazil | The quality of public education provision by the government | Political turnover | Share of Votes |
| Van Der Klaauw (Van Der Klaauw, 2002) | East Coast college’s aid | College enrollment | Offering financial aid | Aid allocation decisions |
| Education | ||||
| Davies et al. (Davies et al., 2018) | Reform of increasing the minimum school leaving age in England | Risk of diabetes and mortality | Remaining in school | Time |
| Huang et al. (Huang & Zhou, 2013) | Great Famine in China | Cognition estimated by episodic memory survey | Completion of primary school | Year of birth and entering primary schooling |
| Clark et al. (Clark & Royer, 2013) | Reform of increasing the minimum school leaving age in England | Adult mortality and health | Remaining in school | Time |
| Science of Science or Innovation Studies | ||||
| Seeber et al. (Seeber et al., 2019) | Scientists’ promotion in Italian higher Education system | Scientists’ number of self-citations | Undergoing the introduction of the habilitation procedure | Time |
| Wang et al. (Y. Wang et al., 2019) | Early-career setback, NIH R01 grant applications | Future Career outcomes | Receiving the R01 grant | Priority score |
| Bol et al. (Bol et al., 2018) | Innovation Research Incentives Scheme for early career scientists, Netherlands | Winning a midcareer grant | Winning the early career award | Evaluation scores |
| Bronzini et al. (Bronzini & Iachini, 2014) | Firms’ R&D subsidy in northern Italy | Investment spending of firms | Receiving funding | Priority score |
| Jacob et al. (Jacob & Lefgren, 2011b) | NIH R01 grant applications | Subsequent publications and citations | Receiving an NIH research grant | Priority score |
| Jacob et al. (Jacob & Lefgren, 2011a) | NIH postdoctoral training grants | Subsequent publications and citations | Receiving an NIH postdoctoral training grant | Priority score |
Counties Characteristic_ Column 1 represents county-level data, including the county poverty rate in 1960, mortality of children aged 5 to 9, and people aged 25 and older in 1973-1983_ Counties with a 1960 poverty rate of 49_198% to 59_198% are the control group, while counties with a 1960 poverty rate of 59_1984% to 69_1984% are the treatment group, i_e_, the poorest counties funded by the HS funding program_
| County-level data | Counties with 1960 poverty 49.198% to 59.198 | Counties with 1960 poverty 59.1984% to 69.1984 | ||||
|---|---|---|---|---|---|---|
| No. of observations (counties) | 347 | 228 | ||||
| Mean | Std | Mean | Std. | |||
| County Poverty Rate 1960 (%) | 54.08 | 2.861 | 63.40 | 2.644 | ||
| Mortality, Ages 5-9, 1973-1983 (%) | 3.044 | 5.897 | 2.316 | 4.566 | ||
| Mortality, Ages 25+, 1973-1983 (%) | 132.5 | 30.96 | 135.7 | 30.53 | ||