
Figure 1

Figure 2
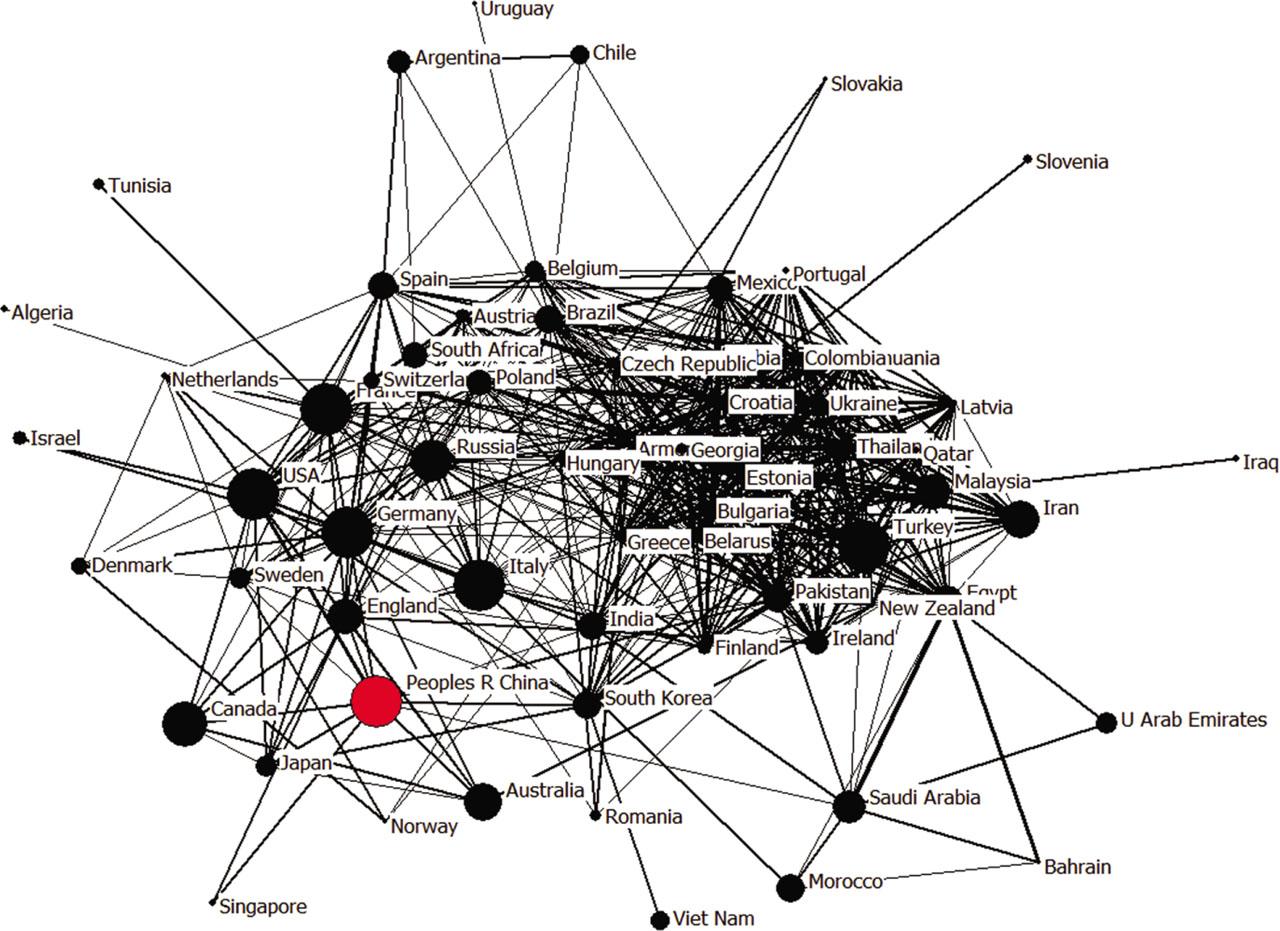
Figure 3
Figure 4
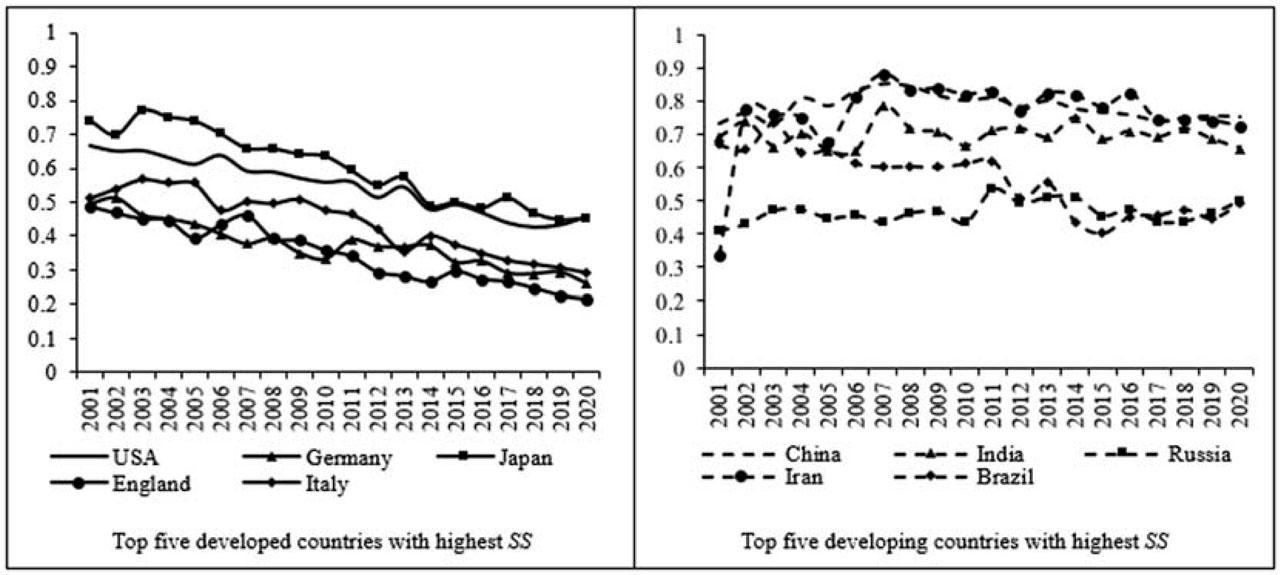
Figure 5
Top 10 countries with the highest number of papers in quantum technology (a) and China's research collaboration layout (b)_
Distribution of the number of countries with AutonomyChina→countries_
| AutonomyChina→countries > 0 | AutonomyChina→countries < 0 | AutonomyChina→countries = 0 | |
|---|---|---|---|
| Developed countries (31) | 28 | 2 | 1 |
| Developing countries (68) | 42 | 11 | 15 |
Ranking of academic contribution (CT) in global quantum technology_
| No. | Country | CT | Contribution proportion | No. | Country | CT | Contribution proportion |
|---|---|---|---|---|---|---|---|
| 1 | USA | 1,593,667.96 | 30.57% | 75 | Cameroon | 364.35 | 0.007% |
| 2 | China | 639,792.41 | 12.28% | 76 | Iceland | 358.65 | 0.007% |
| 3 | Germany | 471,644.89 | 9.05% | 77 | Moldova | 332.54 | 0.006% |
| 4 | England | 317,155.23 | 6.08% | 78 | Indonesia | 326.91 | 0.006% |
| 5 | Japan | 230,317.08 | 4.42% | 79 | Ethiopia | 294.08 | 0.006% |
| 6 | Italy | 199,203.76 | 3.82% | 80 | Philippines | 291.82 | 0.006% |
| 7 | France | 198,179.40 | 3.80% | 81 | Czechoslovakia | 281.92 | 0.005% |
| 8 | Canada | 163,038.66 | 3.13% | 82 | Kazakhstan | 238.84 | 0.005% |
| 9 | Austria | 154,559.69 | 2.96% | 83 | Jordan | 213.80 | 0.004% |
| 10 | Switzerland | 135,561.92 | 2.60% | 84 | Kuwait | 206.25 | 0.004% |
| 11 | Spain | 113,040.28 | 2.17% | 85 | Sri Lanka | 200.63 | 0.004% |
| 12 | Australia | 111,733.35 | 2.14% | 86 | Oman | 196.78 | 0.004% |
| 13 | India | 91,204.80 | 1.75% | 87 | Lebanon | 162.98 | 0.003% |
| 14 | Netherlands | 80,271.91 | 1.54% | 88 | Malta | 155.93 | 0.003% |
| 15 | South Korea | 62,339.05 | 1.20% | 89 | Brunei | 98.70 | 0.002% |
| 16 | Russia | 61,630.01 | 1.18% | 90 | Azerbaijan | 92.67 | 0.002% |
| 17 | Israel | 60,244.46 | 1.16% | 91 | Palestine | 83.25 | 0.002% |
| 18 | Poland | 51,529.10 | 0.99% | 92 | Macedonia | 81.75 | 0.002% |
| 19 | Sweden | 46,708.93 | 0.90% | 93 | Vatican | 74.46 | 0.001% |
| 20 | Brazil | 41,762.49 | 0.80% | 94 | Bosnia & Herceg | 72.07 | 0.001% |
| ... | ... | ... | ... | ... | ... | ... | ... |
| 74 | Bahrain | 368.82 | 0.007% | 147 | Eritrea | 0.23 | 0.000004% |
Distribution of the proportion of papers in the five dominance patterns of DominantChina→countries_
| China | Strongly dominant | Substrongly dominant | Dominant | Subweakly dominant | Weakly dominant |
|---|---|---|---|---|---|
| Developed Countries | 64.13% | 1.64% | 1.01% | 1.26% | 31.96% |
| USA | 79.99% | 2.39% | 0.65% | 1.30% | 15.66% |
| Germany | 66.77% | 0.81% | 1.21% | 0.70% | 30.51% |
| England | 63.17% | 1.02% | 1.89% | 0.87% | 33.04% |
| Japan | 67.23% | 1.38% | 0.61% | 2.60% | 28.18% |
| France | 41.99% | 1.10% | 1.38% | 1.10% | 54.42% |
| Italy | 49.40% | 5.22% | 0.80% | 2.01% | 42.57% |
| Canada | 69.73% | 1.44% | 1.26% | 1.08% | 26.49% |
| Developing Countries | 29.75% | 0.51% | 1.06% | 1.24% | 67.44% |
| India | 42.52% | 2.80% | 1.40% | 2.34% | 50.93% |
| Russia | 31.58% | 0.38% | 1.88% | 0.75% | 65.41% |
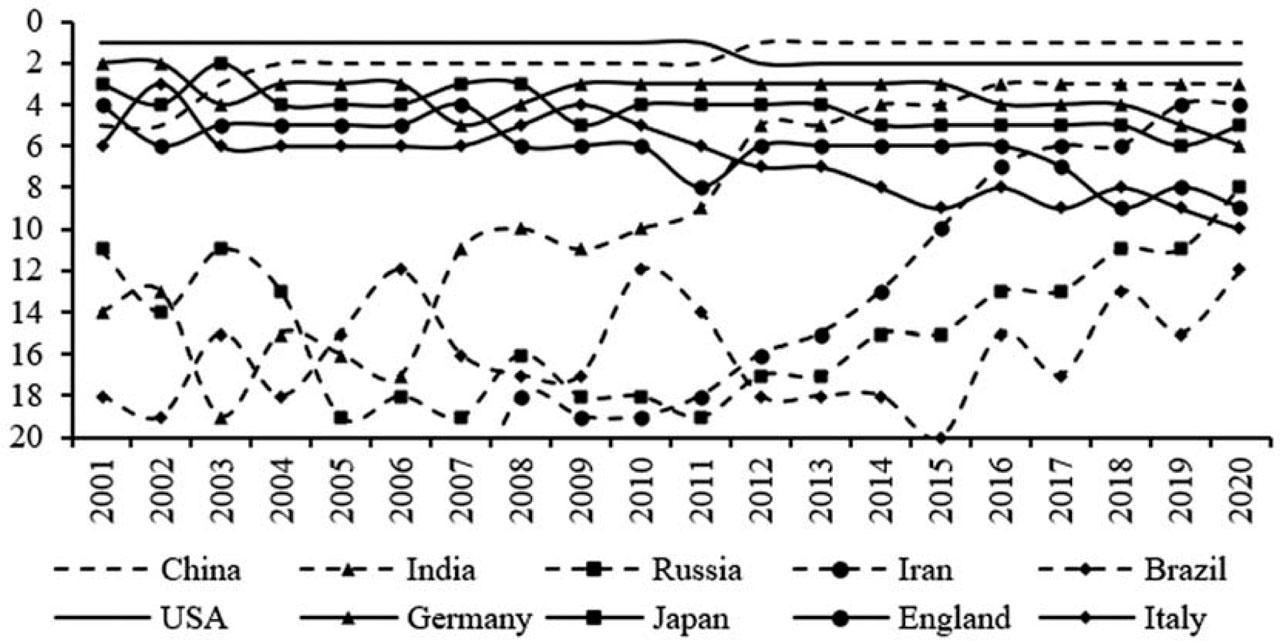
Ranking of scientific research strength index (SS) in global quantum technology_
| No. | Country | SR | SS | No. | Country | SR | SS |
|---|---|---|---|---|---|---|---|
| 1 | USA | 0.54 | 853,088.21 | 75 | Philippines | 0.22 | 63.31 |
| 2 | China | 0.77 | 493,650.57 | 76 | Moldova | 0.19 | 61.86 |
| 3 | Germany | 0.36 | 170,519.88 | 77 | Indonesia | 0.16 | 51.88 |
| 4 | Japan | 0.59 | 136,364.59 | 78 | Macedonia | 0.62 | 50.78 |
| 5 | England | 0.33 | 105,841.36 | 79 | Kazakhstan | 0.21 | 49.26 |
| 6 | Italy | 0.42 | 84,291.22 | 80 | Jordan | 0.21 | 45.08 |
| 7 | India | 0.70 | 63,615.28 | 81 | Cuba | 0.07 | 41.72 |
| 8 | France | 0.32 | 63,100.22 | 82 | Qatar | 0.03 | 35.43 |
| 9 | Canada | 0.34 | 54,791.26 | 83 | Jamaica | 0.61 | 34.89 |
| 10 | Austria | 0.28 | 43,443.24 | 84 | Serbia Monteneg | 0.53 | 30.53 |
| 11 | Switzerland | 0.28 | 37,720.08 | 85 | Bahrain | 0.08 | 29.09 |
| 12 | Australia | 0.33 | 36,955.01 | 86 | Oman | 0.14 | 27.10 |
| 13 | Spain | 0.31 | 34,742.01 | 87 | Sri Lanka | 0.12 | 24.12 |
| 14 | South Korea | 0.55 | 34,124.41 | 88 | Brunei | 0.24 | 23.50 |
| 15 | Russia | 0.46 | 28,491.90 | 89 | North Korea | 0.33 | 23.45 |
| 16 | Iran | 0.77 | 23,826.65 | 90 | Malta | 0.14 | 21.40 |
| 17 | Israel | 0.37 | 22,480.51 | 91 | North Macedonia | 0.29 | 19.60 |
| 18 | Netherlands | 0.27 | 21,887.75 | 92 | Lebanon | 0.10 | 15.97 |
| 19 | Brazil | 0.52 | 21,704.77 | 93 | Bosnia & Herceg | 0.15 | 11.01 |
| 20 | Poland | 0.41 | 20,901.86 | 94 | Azerbaijan | 0.10 | 9.32 |
| … | … | … | … | … | … | … | … |
| 74 | Cyprus | 0.08 | 29.09 | 147 | Panama | −0.08 | −5.01 |
Five dominance patterns of Dominanti→j_
| Collaboration patterns | Dominant country | Largest contributing country | Subordinate country | Weight |
|---|---|---|---|---|
| Strongly dominant | i | i | j | 5/15 |
| Substrongly dominant | i | j | 4/15 | |
| Dominant | i | j | 3/15 | |
| Subweakly dominant | i | j | 2/15 | |
| Weakly dominant | i j | 1/15 |
j_jdis-2022-0019_apptab_001
| Country | Number of Papers | Zero citation Papers | Proportion |
|---|---|---|---|
| USA | 40,906 | 2,224 | 5.44% |
| Peoples R China | 40,180 | 4,876 | 12.14% |
| Germany | 18,633 | 748 | 4.01% |
| England | 11,904 | 441 | 3.70% |
| Japan | 11,726 | 958 | 8.17% |
| Italy | 8,937 | 492 | 5.51% |
| India | 7,394 | 906 | 12.25% |
| Russia | 6,252 | 721 | 11.53% |
| Brazil | 3,520 | 316 | 8.98% |
| Iran | 3,061 | 427 | 13.95% |
Statistics of the network centrality for the top 10 countries with the highest betweenness centrality in quantum technology_
| No. | Country | Betweenness Centrality | Degree Centrality | Closeness Centrality |
|---|---|---|---|---|
| 1 | France | 0.0700 | 106 | 0.7650 |
| 2 | South Africa | 0.0607 | 90 | 0.7083 |
| 3 | USA | 0.0594 | 111 | 0.7846 |
| 4 | Germany | 0.0518 | 106 | 0.7650 |
| 5 | Spain | 0.0516 | 94 | 0.7183 |
| 6 | China | 0.0427 | 99 | 0.7391 |
| 7 | England | 0.0421 | 105 | 0.7612 |
| 8 | India | 0.0384 | 94 | 0.7217 |
| 9 | Canada | 0.0367 | 92 | 0.7116 |
| 10 | Sweden | 0.0335 | 89 | 0.7018 |
Partial results of the research autonomy in national research collaboration (ranking by China's collaboration strength)
| China | USA | Singapore | Japan | Australia | ... | Algeria | |
|---|---|---|---|---|---|---|---|
| China | ↙10.36% | ↙10.66% | ↙11.76% | ↙9.53% | ↙6.67% | ||
| USA | ↙20.02% | ↙12.97% | ↙12.92% | ↙14.18% | ↙12.38% | ||
| Singapore | ↙19.71% | ↙12.88% | ↙15.87% | ↙15.22% | ↙0.00% | ||
| Japan | ↙16.86% | ↙14.51% | ↙10.54% | ↙15.79% | ↙33.33% | ||
| Australia | ↙20.37% | ↙13.28% | ↙11.19% | ↙10.26% | ↙0.00% | ||
| ... | ... | ... | |||||
| Algeria | ↙6.67% | ↙10.48% | ↙0.00% | ↙0.00% | ↙33.33% | ... |
Top 5 collaboration countries with the highest collaboration strength in quantum technology_
| No. | Collaboration country (Number of papers) | Collaboration strengtha | Collaboration papers |
|---|---|---|---|
| 1 | Sri Lanka (64); Cyprus (109) | 0.51 | 43 |
| 2 | Sri Lanka (64); Georgia (139) | 0.46 | 43 |
| 3 | Estonia (189); Sri Lanka (64) | 0.39 | 43 |
| 4 | Cyprus (109); Georgia (139) | 0.38 | 47 |
| 5 | Egypt (1,386); Saudi Arabia (1,567) | 0.36 | 528 |