Figure 1:
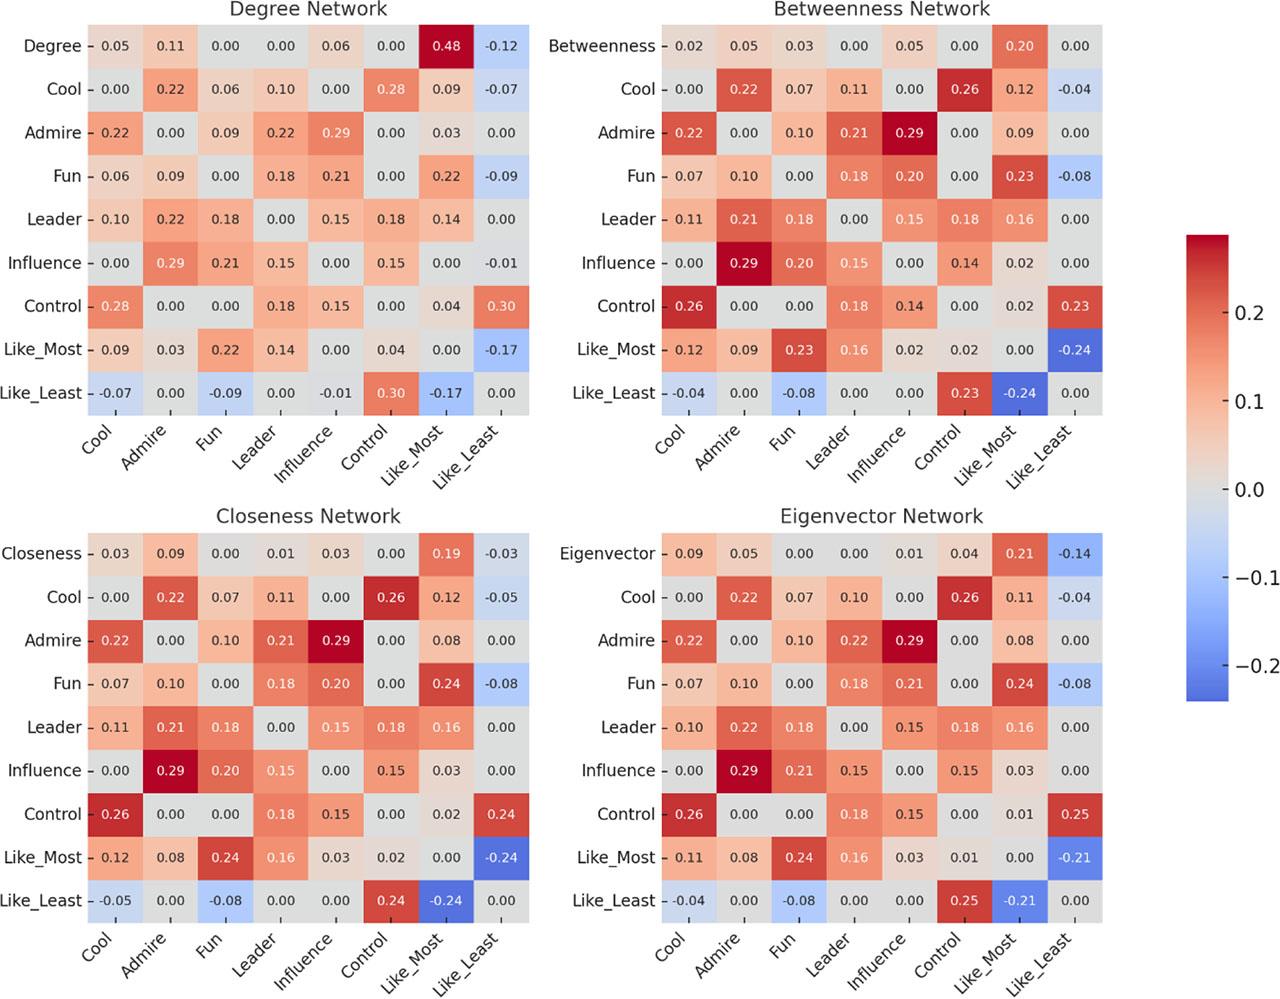
Figure 2:
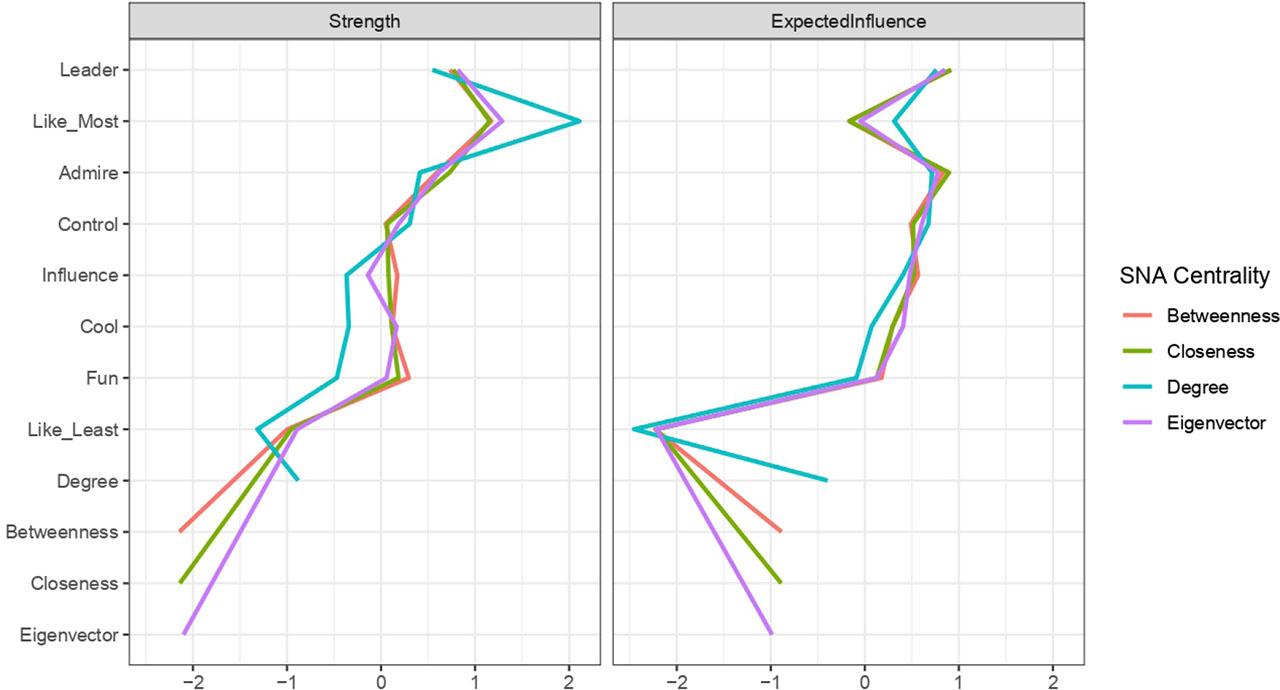
Figure 3:
Demographics and consent rate of classrooms involved in study_
| School/Class | Racial breakdown | Mean age (years) | Grade | Consent rate (%) |
|---|---|---|---|---|
| School 1 (County 1) | ||||
| Class 1 (N = 21) | 85.7% White, 14.3% Black | 11.3 | 5 | 84.0 |
| Class 2 (N = 21) | 66.7% White, 28.6% Black, 4.8% other races | 10.2 | 4 | 87.5 |
| Class 3 (N = 23) | 73.9% White, 26.1% Black | 11.2 | 5 | 88.5 |
| Class 4 (N = 23) | 87.0% White, 13.0% Black | 11.2 | 5 | 85.2 |
| Class 5 (N = 27) | 77.8% White, 22.2% Black | 11.5 | 5 | 100 |
| Class 6 (N = 20) | 70.0%White, 20.0% Black, 10% other races | 10.4 | 4 | 87.0 |
| Class 7 (N = 22) | 90.9% White, 9.1% Black | 11.3 | 5 | 91.7 |
| Class 8 (N = 19) | 78.9% White, 21.1% Black | 11.1 | 5 | 79.0 |
| Class 9 (N = 21) | 66.7% White, 23.8% Black, 9.5%other races | 10.3 | 4 | 87.5 |
| School 2 (County 2) | ||||
| Class 10 (N = 22) | 77.3% White, 18.2% Black, 4.5% other races | 10.3 | 4 | 88.0 |
| Class 11 (N = 19) | 84.2% White, 10.5% Black, 5.3% other races | 10.2 | 4 | 82.6 |
| Class 12 (N = 23) | 95.7% White, 4.3% Black | 11.3 | 5 | 95.8 |
| Class 13 (N = 21) | 76.2% White, 19.1% Black, 4.8% other races | 11.3 | 5 | 91.3 |
| School 3 (County 3) | ||||
| Class 14 (N = 13) | 92.3% Black, 7.7% White | 11.4 | 5 | 81.3 |
| Class 15 (N = 14) | 100% Black | 11.9 | 5 | 82.4 |
| School 4 (County 3) | ||||
| Class 16 (N = 15) | 100% Black | 10.3 | 4 | 83.3 |
| Class 17 (N = 17) | 100% Black | 11.4 | 5 | 85.0 |
| Class 18 (N = 17) | 94.1% Black, 5.9% other races | * | 5 | 89.5 |
| Class 19 (N = 17) | 94.1% Black, 5.9% White | * | 5 | 85.0 |
| School 5 (County 4) | ||||
| Class 20 (N = 15) | 66.7% Black, 33.3% White | 9.3 | 4 | 100 |
| Class 21 (N = 12) | 66.7% Black, 25.0% White, 8.3% other races | 9.3 | 4 | 92.3 |
| Class 22 (N = 15) | 60.0% Black, 40.0% White | 9.4 | 4 | 100 |
| Class 23 (N = 13) | 53.9% Black, 38.5% White, 7.7% other races | 10.3 | 5 | 92.9 |
| Class 24 (N = 15) | 66.7% Black, 26.7% White, 6.7% other races | 10.5 | 5 | 93.8 |
| Class 25 (N = 14) | 64.3% Black, 21.4% White, 14.3% other races | 10.4 | 5 | 93.3 |
| School 6 (County 5) | ||||
| Class 26 (N = 14) | 78.6% Black, 21.4% White | 9.4 | 4 | 87.5 |
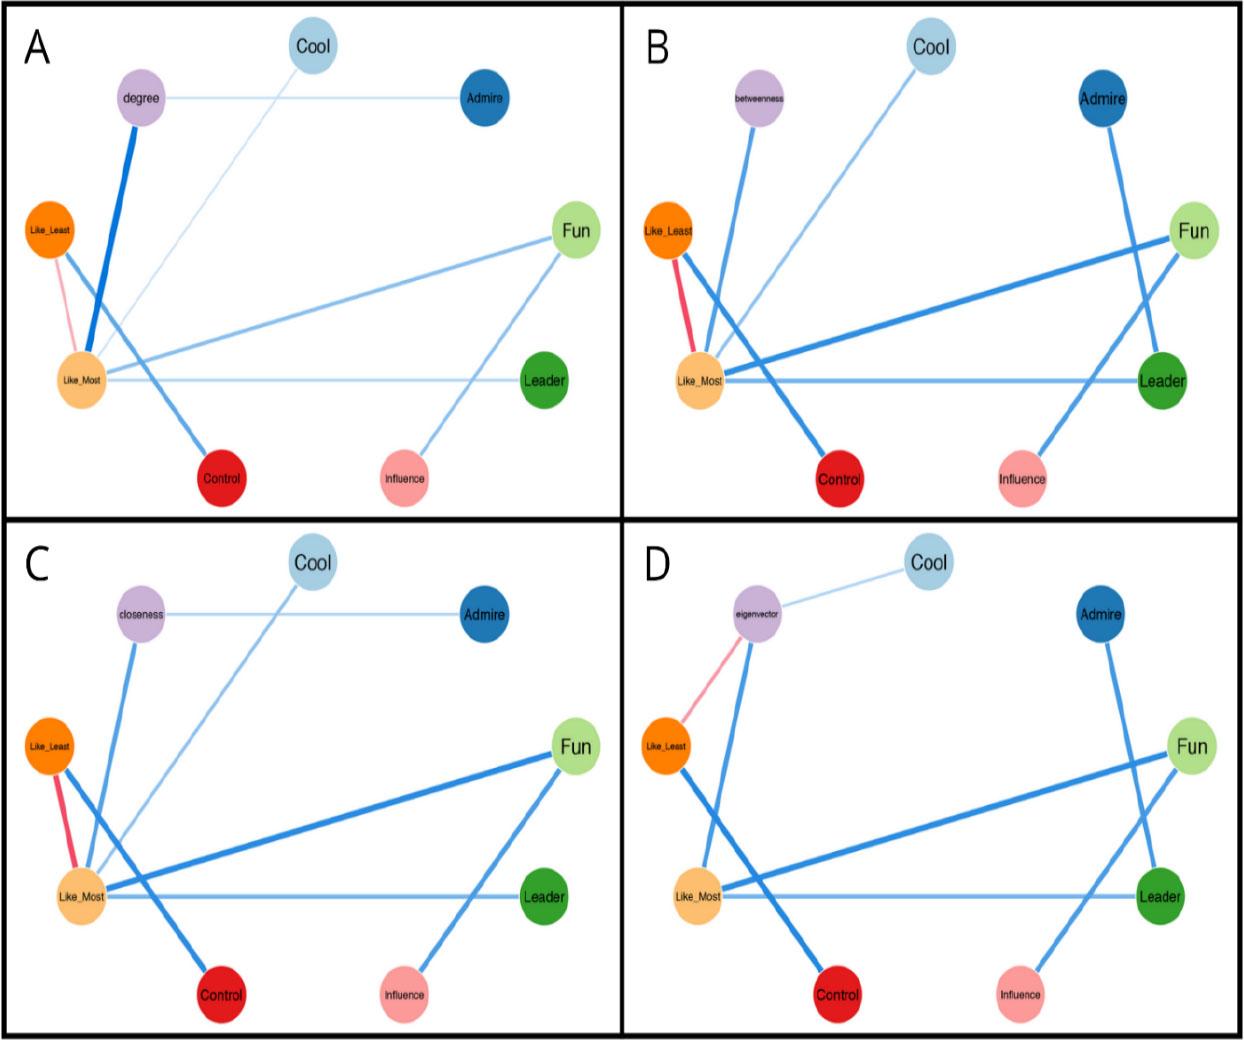
Relationships between centrality measures and peer nomination concepts_
| Centrality measure | Strongest associated peer nomination concepts | Correlation strength |
|---|---|---|
| Degree | Like to play with most | Strong positive (r = 0.48) |
| Like to play with least | Weak negative (r = –0.12) | |
| Admire | Weak positive (r = 0.11) | |
| Betweenness | Like to play with most | Moderate positive (r = 0.20) |
| Closeness | Like to play with most | Moderate positive (r = 0.19) |
| Admire | Weak positive (r = 0.09) | |
| Eigenvector | Like to play with most | Moderate positive (r = 0.21) |
| Like to play with least | Weak negative (r = -0.14) |