Social networks play a crucial role in shaping children’s social experiences and development. Within the school context, peer relationships and social hierarchies emerge as children interact and form complex social structures (Gifford-Smith & Brownell, 2003). These social networks affect various aspects of child development, including social skills, academic achievement, and psychological well-being (Rubin et al., 2011). Understanding the intricacies of these social networks and their impact on child development has been a research focus across multiple disciplines, including sociology, psychology, and education (Cillessen & Bukowski, 2018).
Social network analysis (SNA) has emerged as a powerful tool for examining the structure and dynamics of social relationships (Wasserman & Faust, 1994). SNA provides a quantitative framework for mapping and analyzing the patterns of connections between individuals within a social network (Scott & Carrington, 2011). In the context of child development research, SNA has been applied to investigate the formation and evolution of peer relationships, social hierarchies, and group dynamics within classrooms and schools (Cillessen & Marks, 2017; Kindermann & Gest, 2018). By capturing the complex web of social ties among children, SNA offers valuable insights into the social processes that shape children’s experiences and development. One key aspect of SNA is the concept of centrality, which reflects the importance or prominence of an individual within a social network (Freeman, 2002). Various centrality measures have been developed, each capturing different theoretical aspects of an individual’s position within a network (Borgatti et al., 2018). Degree centrality measures the number of direct connections an individual has, serving as a proxy for popularity (when considering incoming ties) or sociability (Freeman, 2002). Betweenness centrality quantifies the extent to which an individual acts as a bridge between other nodes, indicating potential for information control or mediation (Freeman, 2002). Closeness centrality reflects how proximal an individual is to all others in the network, suggesting efficiency in communication or influence (Freeman, 2002). Eigenvector centrality considers not just the number of connections, but also the centrality of those connections, representing a form of social capital or status (Freeman, 2002). These centrality measures have been used to investigate various aspects of social dynamics, including the concept of popularity. In the child development literature, influential works on popularity in peer networks, such as those by Cillessen and Marks (2011) and Dijkstra et al. (2013), have highlighted the multifaceted nature of popularity, distinguishing between sociometric popularity (being well-liked) and perceived popularity (being seen as popular). In the context of child development research, centrality measures have been employed to investigate the relationship between social network position and various developmental outcomes, such as peer acceptance, social competence, and academic achievement (Andrews et al., 2022; Bond et al., 2017; Makara, 2013). However, the relationship between different centrality measures and these aspects of popularity (i.e., sociometric or perceived) remains an area ripe for exploration, particularly in the context of elementary school social networks.
While SNA provides a robust framework for examining social networks, it is often used in conjunction with other methods to gain a more comprehensive understanding of children’s social experiences. In the field of child development, peer nomination techniques have been widely used to assess various aspects of children’s social functioning, such as popularity, social preference, and social behavior (Cillessen & Bukowski, 2018; Cillessen & Marks, 2017). Peer nominations involve asking children to nominate their peers based on specific criteria, such as who they like the most, who they perceive as popular, or who exhibits certain social behaviors, such as aggression and social withdrawal (Coie et al., 1982). These nominations provide valuable information about children’s social reputation and the perceptions held by their peers.
It is important to note that while both centrality measures and peer nominations can be considered as forms of reputational data (Borgatti et al., 2018), they capture different aspects of social relationships. Centrality measures derived from friendship nominations reflect the structure and patterning of relationships within the friendship network, while other peer nominations (e.g., like, dislike, admire) represent an individual’s perception and evaluation of their peers (Borgatti & Halgin, 2011). By examining the relationships between these different types of network data, we can gain a more comprehensive understanding of the social dynamics at play in children’s peer groups (Cappella et al., 2012; Neal et al., 2016). Recent studies have begun to explore the relationship between social network centrality and peer nominations in the context of child development (Neal, 2024). For example, Cappella et al. (2012) found that children’s degree centrality in friendship networks predicted their peer-nominated social competence and behavioral engagement in the classroom. Similarly, Neal et al. (2016) demonstrated that children’s betweenness centrality in peer networks was associated with their peer-nominated social dominance and aggression. These findings support social network theory and suggest that the structural properties of children’s social networks, as captured by centrality measures, are related to their social reputation and behavior as perceived by their peers.
Network analysis is a valuable tool for understanding the complex relationships between variables in child development research. By conceptualizing variables as nodes and their relationships as edges in a network, this approach allows researchers to examine the intricate patterns of associations and influences among multiple factors simultaneously (Epskamp et al., 2018). For instance, in the context of child development, Pollmann et al. (2023) modeled the interrelations of adversities in childhood and adolescence and examined adversity clusters. Through network analysis, they found clusters of adverse events through childhood and adolescence, including direct abuse and adverse family factors, and found these adversities closely linked to depression in early adulthood. Moreover, De Neve et al. (2023) similarly modeled the interrelations between concepts related to social relations, social engagement, and emotion regulation, with the pairwise correlations between these concepts serving as the ties connecting them in the network model. They found that nodes representing emotional and behavioral student engagement were strongly related, and facets of emotion regulation difficulties were interconnected. They also found that teacher and peer relations were both directly and indirectly connected to emotion regulation. These examples illustrate the utility of network analysis in uncovering the complex relationships between variables in child development research, enabling researchers to identify key mechanisms and potential intervention targets to support children’s healthy development.
Despite the extensive use of peer nomination methods and increasing use of SNA in child development research, there has been limited integration of these two approaches, particularly in examining how different centrality measures relate to various peer-nominated social constructs. This gap in the literature presents an opportunity to explore how the structural properties of children’s social networks, as captured by different centrality measures, relate to variables indexing peer perceptions and social reputations. Our study aims to address this gap by investigating the relationships between multiple centrality measures (degree, betweenness, closeness, and eigenvector) derived from friendship nominations and various peer-nominated social constructs (e.g., like to play with most, like to play with least, perceived as cool, admired) in elementary school classrooms. By doing so, we seek to provide novel insights into how different aspects of network centrality correspond to peer perceptions and social functioning. This approach goes beyond simple co-occurrence of relationships or node-level regressions by examining the nuanced ways in which different centrality measures capture distinct aspects of social standing and how these relate to a range of peer-nominated constructs. This research contributes to the field by providing a comprehensive comparison of multiple centrality measures in relation to various peer-nominated social constructs, offering insights into the unique information captured by each centrality measure in the context of children’s social experiences, and bridging the gap between structural network analysis and peer perception research in the child development literature. By integrating these perspectives, we aim to enhance our understanding of the complex interplay between children’s positions in social networks and their perceived social functioning.
This study employed a cross-sectional design to investigate the relationships between social network centrality and peer nominations in elementary school classrooms. The project aimed to bridge the gap between SNA and child development research by first using SNA to map the social networks within classrooms and derive centrality measures, and then applying network analysis to examine how these centrality measures relate to various dimensions of peer-nominated social functioning. The study was conducted in multiple elementary schools, with data collected from students in Grades 4 and 5.
Participants in this study were 473 fourth (n = 174) and fifth (n = 299) grade students (52% girls), ranging from 9 years to 12 years of age (mean age of 10.6 years). They were recruited in May 2004 from six elementary schools located in five counties within the southeastern region of the United States. The counties were rural, with no cities of population >4,000. The ethnic/racial composition of the sample was as follows: 54% White, 43% Black, and 3% Asian, Hispanic/Latino, American Indian/Alaskan Native, Native Hawaiian/Pacific Islander, or biracial (see Table 1 for a breakdown by class and school). School records indicated that two of the schools were majority-White and four were majority-Black. Overall, 79.9% of participants were of the majority race within their school. The racial/ethnic composition of the classrooms within each school closely approximated the school’s and county’s overall composition. We were not allowed to collect socioeconomic data for individual students. However, the schools were located in counties comparable on wealth and educational status, with median household income averaging US$28,574 and all counties well below the United States median family income (US$59,600; U.S. Census Bureau, 2006). Free and reduced lunch eligibility averaged 70% across schools. Parental consent and student assent were required for participation, with an overall consent rate of 88.7% and no classroom consent rate falling below 79%. The study was approved by the university’s Institutional Review Board.
Demographics and consent rate of classrooms involved in study.
| School/Class | Racial breakdown | Mean age (years) | Grade | Consent rate (%) |
|---|---|---|---|---|
| School 1 (County 1) | ||||
| Class 1 (N = 21) | 85.7% White, 14.3% Black | 11.3 | 5 | 84.0 |
| Class 2 (N = 21) | 66.7% White, 28.6% Black, 4.8% other races | 10.2 | 4 | 87.5 |
| Class 3 (N = 23) | 73.9% White, 26.1% Black | 11.2 | 5 | 88.5 |
| Class 4 (N = 23) | 87.0% White, 13.0% Black | 11.2 | 5 | 85.2 |
| Class 5 (N = 27) | 77.8% White, 22.2% Black | 11.5 | 5 | 100 |
| Class 6 (N = 20) | 70.0%White, 20.0% Black, 10% other races | 10.4 | 4 | 87.0 |
| Class 7 (N = 22) | 90.9% White, 9.1% Black | 11.3 | 5 | 91.7 |
| Class 8 (N = 19) | 78.9% White, 21.1% Black | 11.1 | 5 | 79.0 |
| Class 9 (N = 21) | 66.7% White, 23.8% Black, 9.5%other races | 10.3 | 4 | 87.5 |
| School 2 (County 2) | ||||
| Class 10 (N = 22) | 77.3% White, 18.2% Black, 4.5% other races | 10.3 | 4 | 88.0 |
| Class 11 (N = 19) | 84.2% White, 10.5% Black, 5.3% other races | 10.2 | 4 | 82.6 |
| Class 12 (N = 23) | 95.7% White, 4.3% Black | 11.3 | 5 | 95.8 |
| Class 13 (N = 21) | 76.2% White, 19.1% Black, 4.8% other races | 11.3 | 5 | 91.3 |
| School 3 (County 3) | ||||
| Class 14 (N = 13) | 92.3% Black, 7.7% White | 11.4 | 5 | 81.3 |
| Class 15 (N = 14) | 100% Black | 11.9 | 5 | 82.4 |
| School 4 (County 3) | ||||
| Class 16 (N = 15) | 100% Black | 10.3 | 4 | 83.3 |
| Class 17 (N = 17) | 100% Black | 11.4 | 5 | 85.0 |
| Class 18 (N = 17) | 94.1% Black, 5.9% other races | * | 5 | 89.5 |
| Class 19 (N = 17) | 94.1% Black, 5.9% White | * | 5 | 85.0 |
| School 5 (County 4) | ||||
| Class 20 (N = 15) | 66.7% Black, 33.3% White | 9.3 | 4 | 100 |
| Class 21 (N = 12) | 66.7% Black, 25.0% White, 8.3% other races | 9.3 | 4 | 92.3 |
| Class 22 (N = 15) | 60.0% Black, 40.0% White | 9.4 | 4 | 100 |
| Class 23 (N = 13) | 53.9% Black, 38.5% White, 7.7% other races | 10.3 | 5 | 92.9 |
| Class 24 (N = 15) | 66.7% Black, 26.7% White, 6.7% other races | 10.5 | 5 | 93.8 |
| Class 25 (N = 14) | 64.3% Black, 21.4% White, 14.3% other races | 10.4 | 5 | 93.3 |
| School 6 (County 5) | ||||
| Class 26 (N = 14) | 78.6% Black, 21.4% White | 9.4 | 4 | 87.5 |
Missing data.
The data examined in this study were collected as part of a larger study on children’s peer relations, with data collection taking place in two 1-hour sessions. Peer nomination procedures were used to collect the data reported on in this study. Participants completed peer nominations prior to reporting on their friendship network ties. To facilitate the nomination process, students were provided with a roster of all consenting participants in their classroom. A fixed-choice procedure was used to reduce respondent burden, with the number of nominations capped at three. However, children were allowed to nominate fewer than three peers to reduce the pressure to nominate peers who were not actually close friends or who did not “fit” a given descriptor. Although fixed choice designs might limit a child’s opportunity to name all close friends (Adams, 2020; Marsden, 2011), a recent meta-analysis reported that the pooled estimate from studies using an unlimited procedure was 3.76 close friends (Neal, 2024). Furthermore, McKirahan et al. (2022) reported that the number of nominations children made using an unlimited choice procedure, when provided with a roster of grade-level peers, of similar peer nomination items was close to our cap of three, with a mean of 3.91 nominations for “like to play with most” (3.72 when using a free recall method), 3.75 for “like to play with least” (2.08 using free recall), and 2.59 nominations for “leader” (1.98 using free recall).
Students were instructed that they could nominate up to three participating classmates for each peer nomination item and could nominate a peer for more than one item. To assess social reputation, participants were asked to nominate peers who fit various indicators of social functioning (Lease et al., 2002), including those they like to play with the most (“Like Most”) and the least (“Like Least”), those considered cool (“really cool-just about everybody in school knows this person”), admired (“others in class admire this person—they want to be around this person and be like him/her”), fun (“fun to hang around, because this person has a good sense of humor and has good ideas for things to do”), leaders (“gets chosen by the others as the leader—others like to have this person in charge”), influential (“others listen to—this person has a lot of influence”), and those who have social control (“has a lot of control— they decide who gets to be in the popular group or ‘in crowd’ ”). For each descriptor, the number of nominations received by each student was tallied and standardized within classrooms to account for differences in class size (Cillessen & Marks, 2017).
To assess the social networks within each classroom, students were asked to report on their three closest friends in their classroom (Bukowski et al., 1993). Data from all peer reporters were used to create a directed friendship matrix for each of the 26 classrooms. Columns and rows corresponded to students, with each cell indicating the absence (0) or presence (1) of a friendship nomination. The friendship matrices were used to construct an adjacency matrix for each classroom. From these adjacency matrices, four centrality measures were calculated for each student: degree centrality, betweenness centrality, closeness centrality, and eigenvector centrality. These centrality measures were normalized within classrooms to account for differences in network size. Social network centrality measures were calculated using the igraph package (Csardi & Nepusz, 2006) in R.
Network analyses were conducted to examine the relationships between the social network centrality measures and the peer nomination variables. For each centrality measure, we estimated a separate network, where the nodes represent the centrality measure and different peer nomination categories (e.g., “Like Most”, “Like Least”, “Cool”), while the edges represent the relationships or associations between these variables. Previous studies have already examined the empirical and theoretical relationships between centrality measures in networks (Oldham et al., 2019; Valente et al., 2008); however, this study aims to examine relationships between these centrality measures (in isolation) with peer nominations of social status. To better understand how centrality measures (degree, betweenness, eigenvector, closeness) from friendship nominations are represented in peer nominations of social status, individual models (in this case networks) are need for each so as to not engage with collinearity that is already established between the centrality measures.
To estimate these networks of associations, we used the EBICglasso function from the qgraph package in R (Epskamp et al., 2012). The glasso method employs a regularization technique that shrinks parameter estimates, forcing weaker relationships to become exactly zero (Costantini et al., 2015; Epskamp & Fried, 2018). This results in a sparse network, where only the most important relationships are retained. The primary motivation for using glasso is its ability to handle smaller sample sizes while controlling for spurious connections, which is particularly important when sample size limitations could otherwise inflate the likelihood of false positives. Networks were determined via the Minimizing the Extended Bayesian Information Criterion (EBIC) (Chen & Chen, 2008), which has been shown to yield high specificity, increasing the confidence of retrieving true network structures (Foygel & Drton, 2010). This regularization process method stabilizes the estimated model by penalizing overfitting and enhances the accuracy of detecting genuine relationships between variables (Epskamp & Fried, 2018). This allows us to estimate the connections between peer nominations and centrality measures with confidence while minimizing noise in the data.
The stability and accuracy of the estimated networks were assessed using several methods. First, edge weight accuracy was examined using nonparametric bootstrapping with 2,000 samples to construct 95% confidence intervals around each edge weight. Second, centrality stability was evaluated using the case-dropping subset bootstrap method (Epskamp et al., 2018) to determine the proportion of cases that can be dropped while maintaining a correlation of at least 0.7 between the original centrality indices and those derived from the subsets. The correlation stability coefficient (CS-coefficient) was used to quantify centrality stability, with values above 0.5 indicating stable centrality estimates (Isvoranu & Epskamp, 2023). In other words, centrality stability assessments were used to determine which characteristics (i.e., strength, expected influence (EI), betweenness, closeness) were stable within these networks to interpret in further analysis. Centrality stability assessments revealed Strength (CS [cor = 0.7] ≈ 0.439–0.749) and EI (CS [cor = 0.7] ≈ 0.749–0.749) to consistently show CS coefficients around or above 0.5, indicating robust stability. Conversely, Betweenness (CS [cor = 0.7] ≈ 0.051–0.361) and Closeness (CS [cor = 0.7] ≈ 0.127 –0.516) exhibited lower CS coefficients (<0.25), suggesting instability, and warranted caution in interpretation; thus, these indices were excluded from further analysis.
“Strength” represents the sum of the absolute values of the edges connected to a node, providing an indication of how well-connected a node is within the network. Strength is particularly useful when the goal is to determine which variables have the most overall associations. However, “Strength” is constrained by its absolute value calculation, informing centrality for positive edges only. “Expected Influence” broadens this scope by capturing both positive and negative influences. It reflects how a node influences and is influenced by others in the network, allowing us to identify nodes that activate or inhibit others. This distinction is particularly important in our analysis, as peer nominations can reflect both positive and negative social perceptions, and understanding these dynamics requires a metric that goes beyond mere connectivity to capture the direction of influence. Given the unsuitability of code reversal in our observed networks, both “Strength” and “Expected Influence” were selected for interpretation (Robinaugh et al., 2016). “Strength” was used to determine the most connected variables, while “Expected Influence” allowed us to distinguish which peer nominations had the most significant positive or negative effects on other social constructs, providing insights into the complex dynamics of children’s social relationships and reputations among peers. Edge weight accuracy was also evaluated for each of the estimated networks. Calculated bootstrap confidence intervals for the relationships observed were small to moderate in width, indicating a good level of network accuracy. See Supplementary Material 1 for all centrality outputs (strength, betweenness, closeness, EI), along with edge weight accuracy and centrality stability figures.
To further explore the relationships between the centrality measures and peer nomination variables, shortest path analyses were conducted using the shortest paths function from the qgraph package. The shortest path between two nodes represents the minimum number of steps required to move from one node to another and was computed using Dijkstra’s algorithm (Dijkstra, 1959). This analysis provides insights into both the direct and indirect relationships between centrality measures and peer nominations by revealing how these variables are connected through intermediary steps (Brandes, 2008). By identifying the most efficient pathways between different aspects of social structure and peer perceptions, offering a more nuanced view of how centrality in friendship networks relates to various dimensions of social reputation.
Comparisons between the networks were conducted descriptively using a heat map visualisation of partial correlations derived from the estimated networks. This approach provided an intuitive means to compare edge weights and connection patterns, allowing key similarities and differences to be identified through visual inspection. No formal statistical analyses were conducted for the network comparisons. All data analyses were conducted in R version 4.0.5. Network estimation and visualization were handled using the qgraph package version 1.6.9 (Epskamp et al., 2012) and the bootnet package version 1.4.3 (Epskamp et al., 2018). The bootnet package specifically handled the network stability and accuracy analyses.
Across the estimated networks, the strongest association observed among the SNA centrality and the social reputation peer nomination variables was consistently a positive connection with “Like to play with most”, with relationships ranging in strength (r = 0.19–0.48), and “degree” displaying the strongest connection (r = 0.48) among the SNA centrality indicators. Among the estimated networks, the strongest negative associations observed between SNA centrality and the social reputation peer nomination variables were “eigenvector” (r = -0.14) and “degree” (r = -0.12) with “Like to play with least”, whereas “betweenness” and “closeness” displayed either nominal or no negative associations in the observed networks. Figure 1 displays the estimated networks for each centrality measure. In these visualizations, partial correlations are displayed between each variable in the network. Table 2 summarizes these relationships, illustrating the strength and nature of associations between centrality measures and peer nomination concepts.
Relationships between centrality measures and peer nomination concepts.
| Centrality measure | Strongest associated peer nomination concepts | Correlation strength |
|---|---|---|
| Degree | Like to play with most | Strong positive (r = 0.48) |
| Like to play with least | Weak negative (r = –0.12) | |
| Admire | Weak positive (r = 0.11) | |
| Betweenness | Like to play with most | Moderate positive (r = 0.20) |
| Closeness | Like to play with most | Moderate positive (r = 0.19) |
| Admire | Weak positive (r = 0.09) | |
| Eigenvector | Like to play with most | Moderate positive (r = 0.21) |
| Like to play with least | Weak negative (r = -0.14) |
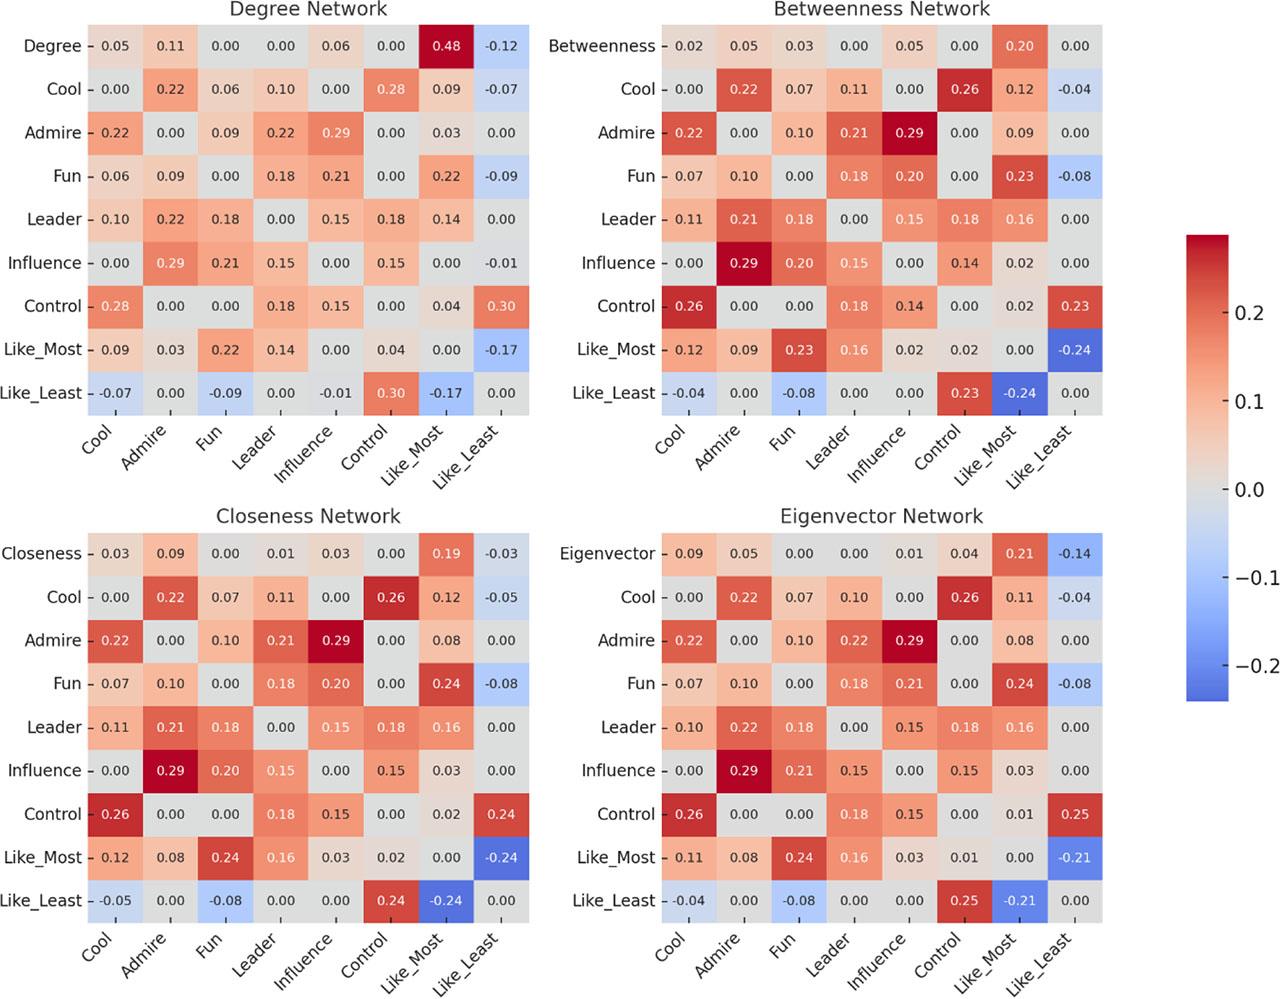
Heat map visual display of partial correlations from the four estimated networks linking peer nomination variables to SNA centrality measures.
The Strength and EI analyses (see Figure 2) revealed key insights into the relationships between centrality measures and peer nominations. “Like to play with most” emerged as the most central variable across all networks, particularly in the degree centrality network (Strength: 2.11), indicating its strong positive connections with other variables. This suggests that being a child who others like to play with is closely associated with various aspects of social network centrality, especially with having numerous direct connections. However, the EI analysis provided a more nuanced picture. While “Like to play with most” showed high Strength, its EI was relatively weak, particularly in the betweenness, closeness, and eigenvector networks. In contrast, “Like to play with least” consistently demonstrated the strongest negative influence (EI: -2.21 to -2.45) across all networks, indicating its powerful role in shaping social dynamics. This finding highlights the potentially more impactful nature of negative peer perceptions in children’s social networks. Interestingly, “Leader” and “Admire” emerged as influential nodes in both analyses, showing high Strength (0.55–0.82 and 0.41–0.73, respectively) and positive (EI: 0.76–0.92 and 0.71–0.89, respectively). This suggests that leadership qualities and admiration play significant roles in shaping social network structures and peer perceptions, potentially serving as bridges between centrality measures and other social reputation variables.
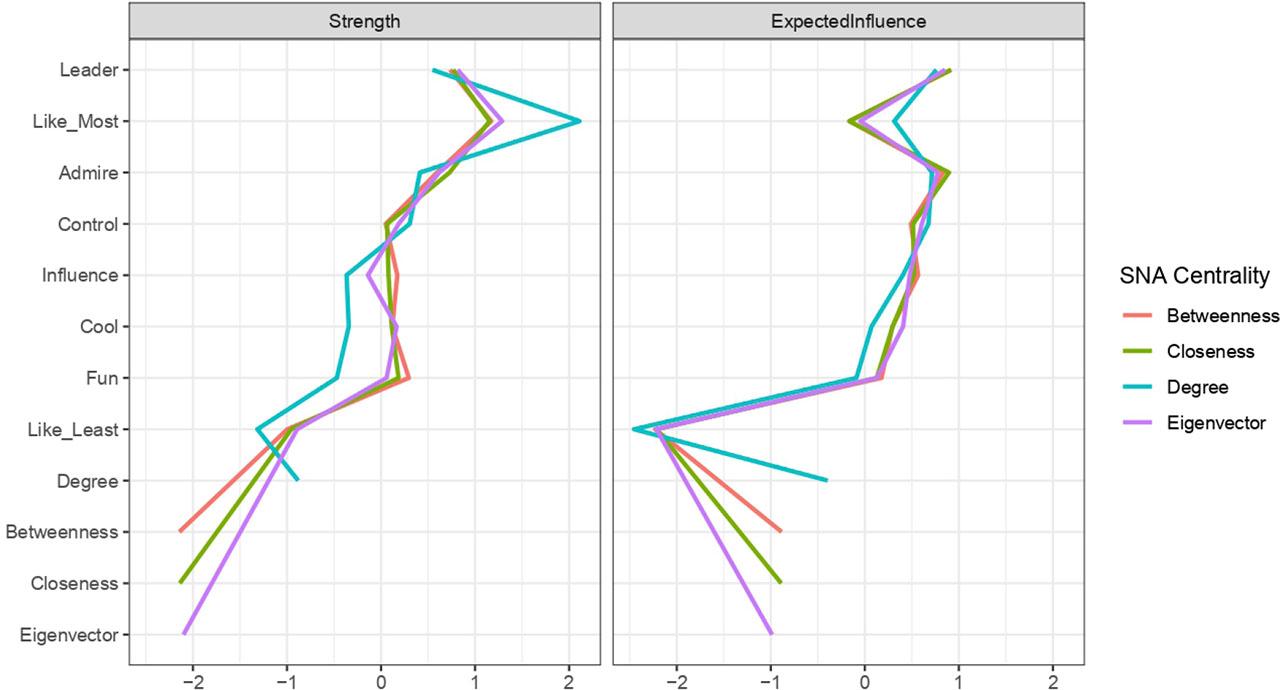
“Strength” and “Expected Influence” centrality z-scores for SNA centrality “degree”, “betweenness”, “closeness”, “eigenvector” and social reputation peer nomination variables. Note. Standardized z-scores: For node strength, values greater than zero indicate high strength. For EI, values further from zero indicate high influence, with positive or negative values indicating the direction of the influence. EI, expected influence; SNA, social network analysis.
The shortest path analysis (see Figure 3) provides insights into the direct and indirect relationships between centrality measures and peer nominations, revealing the most efficient pathways through which different aspects of social network position connect to various dimensions of peer-perceived social functioning. Across all estimated networks, “Like to play with most” consistently displayed direct associative connections with each SNA centrality index. For the “degree” network (Figure 3A), additional direct connections were observed with “Admire”, while “Cool”, “Fun”, “Leader”, and “Like to play with least” connected most efficiently through an intermediary step involving “Like to play with most”. The remaining variables, “Influence” and “Control”, connected to “degree” via two intermediary steps. In the “betweenness” network (Figure 3B), a single direct connection was noted between “Betweenness” and “Like to play with most”. Similar to the “degree” network, “Cool”, “Fun”, “Leader”, and “Like to play with least” were connected to “Betweenness” through an intermediary step involving “Like to play with most”. “Influence”, “Admire”, and “Control” connected to “Betweenness” via two intermediary steps. The “closeness” network (Figure 3C) displayed direct connections between “Closeness” and both “Like to play with most” and “Admire”. As in the previous networks, “Cool”, “Fun”, “Leader”, and “Like to play with least” were efficiently connected to “Closeness” through an intermediary step involving “Like to play with most”, while “Influence” and “Control” were connected via two intermediary steps. Finally, the “eigenvector” network (Figure 3D) revealed direct associative connections with “Like to play with most”, “Like to play with least”, and “Cool”. “Fun” and “Leader” were efficiently connected to “Eigenvector” through intermediary steps involving “Like to play with most”, whereas “Control” was connected via “Like to play with least”. The remaining variables, “Influence” and “Control”, connected to “Eigenvector” through two intermediary steps.
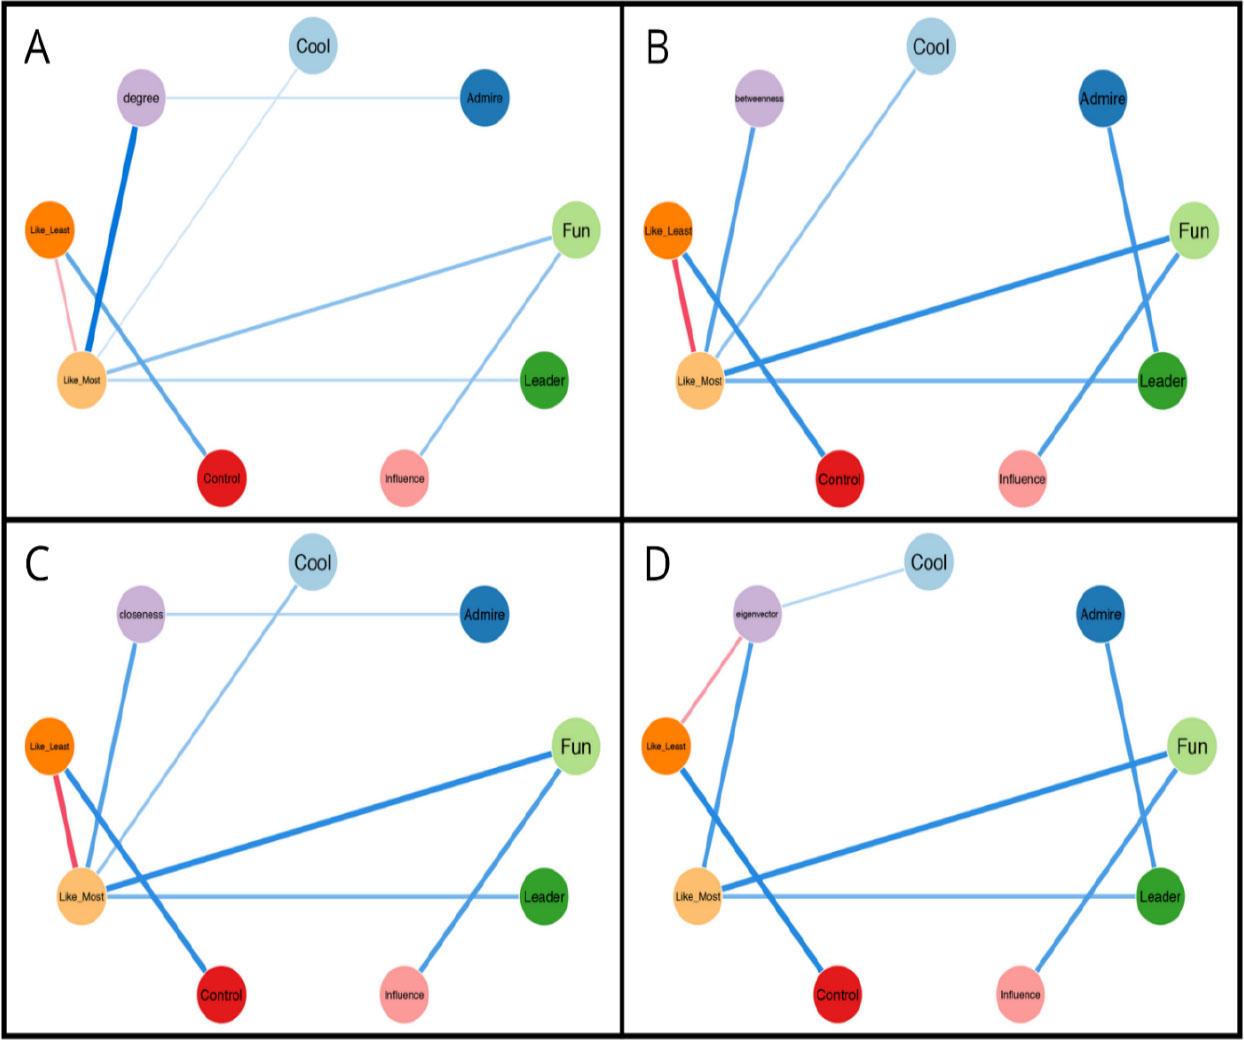
Shortest paths between SNA centrality measures: (A) “degree”, (B) “betweenness”, (C) “closeness”, (D) “eigenvector”, and the social reputation peer nomination variables. Note. Estimated network. Blue lines = positive relationships; red lines = negative relationships. Thicker lines between variables indicates a stronger relationship. SNA, social network analysis.
The findings of this study have important implications for both research and practice. By taking a network analytic approach in child development research and bridging the gap between SNA and peer nomination methods, this study contributes to a more comprehensive understanding of children’s social experiences and the factors that shape their social development. The insights gained from this study can inform the development of targeted interventions and strategies to support children’s social competence, peer relationships, and overall well-being within the school context. Moreover, by demonstrating the value of combining SNA and peer nomination methods, this study paves the way for future research that leverages the strengths of both approaches to advance our understanding of children’s social worlds.
Across all four centrality measures (degree, betweenness, closeness, and eigenvector), who children report liking to play with most (“Like Most”) consistently emerged as the strongest correlate, emphasizing the crucial role of this affectively laden preference in shaping children’s social experiences within their friendship networks. This finding aligns with previous research that has consistently demonstrated the significance of being liked by peers in determining social status, peer relationships, and overall well-being (Gifford-Smith & Brownell, 2003; Rubin et al., 2011). Children who are well-liked by their peers are more likely to occupy central positions within their social networks, have access to social resources and support, and experience positive social and emotional outcomes (Cillessen & Bukowski, 2018). This finding also aligns with social network theory, which often uses degree centrality as a proxy for popularity. Conversely, who children liked to play with least (“Like Least”) displayed negative associations with centrality measures, particularly affecting their betweenness centrality (ability to bridge different social groups) and eigenvector centrality (connections to other well-connected peers). This suggests that peer rejection or exclusion from play-based and affiliative activities specifically hinders children’s ability to serve as intermediaries between different peer groups and limits their access to influential social circles within the network. This finding is consistent with research indicating that disliked children often experience social isolation, limited peer support, and negative social and emotional outcomes (Gifford-Smith & Brownell, 2003; Rubin et al., 2011). The consistent emergence of “Like to play with most” and “Like to play with least” as key variables across all centrality measures underscores the fundamental importance of peer acceptance and rejection in affiliative and play-based activities for shaping children’s social experiences within the friendship network and highlights the need for interventions and practices that promote positive peer interactions and mitigate the negative effects of behaviors that cause children to be disliked and excluded (Cillessen & Marks, 2017).
Several social reputation variables demonstrated significant importance across the different network models. “Leader” and “Admire” consistently exhibited high strength and EI centrality, indicating their central role in shaping the social dynamics within the classroom. These findings align with previous research highlighting the significance of leadership and admiration in determining social status among peers (Lease et al., 2002). Children who are perceived as leaders and admired by their peers are likely to hold central positions within their social networks, impact group norms and behaviors, and serve as role models for their classmates (Andrews et al., 2022). The high centrality of these variables suggests that cultivating leadership skills and fostering a culture of admiration and respect among peers may be important strategies for promoting positive social dynamics and supporting children’s social development. Additionally, “Control” and “Influence” displayed moderate to high EI in the closeness and eigenvector networks, suggesting that the ability to exert social control is closely tied to occupying central positions within the social network and having greater social capital through their position and reach to other central nodes (Borgatti et al., 2018; Freeman, 2002). Children who are perceived as having social control are likely to shape group norms, decision-making processes, and social interactions within the classroom (Neal et al., 2016). These findings highlight the importance of considering power dynamics and social processes in understanding children’s peer relationships and social functioning.
Path analysis results also demonstrated interesting connections between peer nomination variables and centrality measures. First, findings suggest a potential social pathway where influential children are perceived as fun by their peers, which in turn leads peers to like playing with them. This pathway may exist because influential children often have the social skills and resources to organize enjoyable activities or create entertaining social situations, making them appealing playmates (Lease et al., 2002; Rodkin et al., 2006). They may also be more likely to sway others if they are well-liked. Additionally, the association between influence and being fun might reflect these children’s ability to shape group norms and activities in ways that their peers find engaging and enjoyable, ultimately contributing to their likability within the peer group (Cillessen & Marks, 2011; van den Berg et al., 2020). In contrast, there was a simultaneous pathway between “control” and “like least.” This suggests that while fun children are seen as influential and well-liked, others who exert social control may be viewed negatively by their peers (McMillin, 2021; van den Berg et al., 2020). The distinction between these pathways may reflect different styles of social influence, where children who use their influence in a more controlling or domineering manner are less liked than those who use it to facilitate enjoyable social interactions (McMillin, 2021; van den Berg et al., 2020). This finding highlights the complex nature of social dynamics in childhood, where the outcomes of social influence can vary depending on how it is perceived and exercised within the peer group (McMillin, 2021; van den Berg et al., 2020). Lastly, “Cool” had a direct pathway to eigenvector centrality but was indirectly connected to the other centrality measures through “Like to play with most.” This may be indicative of the theoretical properties of eigenvector as a measure of being close to the most connected people yet not necessarily being the most connected or liked (Borgatti et al., 2018). This proximity to popular people may impart a notion of “Cool.” In the social development literature, aggressive or mildly disruptive peers are more often perceived as “cool,” which may help explain the link between this perception and eigenvector centrality (Lindstrom et al., 2007; Rodkin et al., 2006).
The findings of this study have important implications for research on child development and social networks. By demonstrating the value of combining SNA and peer nomination methods, this study paves the way for future research that leverages the strengths of both approaches to advance our understanding of children’s social worlds. The insights gained from this study highlight the need for researchers to consider multiple dimensions of social functioning and employ diverse methodological approaches to capture the complexity of children’s peer relationships and social experiences (Cillessen & Marks, 2017). Future research should explore the dynamic and evolving nature of social networks and social reputation over time, investigate the factors that contribute to the formation and maintenance of peer relationships, and examine the long-term consequences of social network position and social reputation for children’s development and well-being (Bond et al., 2017; Cappella et al., 2012). Additionally, researchers should consider the role of contextual factors, such as classroom climate, teacher–student relationships, and school policies, in shaping children’s social networks and social experiences (Kindermann & Gest, 2018).
From a practical perspective, the results of this study can inform the development of targeted interventions and strategies to support children’s social competence, peer relationships, and overall well-being within the school context. Educators and practitioners can use the insights gained from this study to identify children who may be at risk of social isolation or exclusion and design interventions that promote positive peer interactions and foster a supportive classroom environment. For example, interventions that focus on developing children’s social skills, promoting inclusive and cooperative learning activities, and facilitating positive peer interactions may help to enhance children’s social competence and promote positive peer relationships (Gifford-Smith & Brownell, 2003). Moreover, fostering within-network clusters where children can experience centrality at a more micro-level could mitigate effects of less connected positions in the larger network. Additionally, educators can use social network data to identify key influencers and leaders within the classroom and leverage their social capital to promote positive social norms and behaviors (Laursen & Faur, 2022; Lease et al., 2002). By understanding the role of social network position in shaping children’s social experiences, practitioners can work to create inclusive and equitable learning environments that support the social and emotional development of all children (Kindermann & Gest, 2018).
This study provides valuable insights into how different centrality measures relate to peer-nominated social constructs in elementary school settings. Our findings contribute to a more nuanced understanding of what each centrality measure represents in terms of children’s social experiences and peer perceptions. For example, degree centrality demonstrated the strongest positive association with “Like to play with most” nominations, suggesting that at this developmental stage, being a child who others like to play with is closely tied to having numerous friendship connections. This aligns with theories of social preference in childhood, which posit that children who form and maintain multiple positive relationships are often viewed favorably by their peers (Gifford-Smith & Brownell, 2003). The strong correlation between degree centrality and likability may indicate that these children possess advanced social skills, approachability, and the ability to navigate multiple peer relationships successfully (Rubin et al., 2011).
Other centrality measures offered unique insights into children’s social standing. Betweenness centrality’s moderate positive association with “Like to play with most” suggests that children who bridge different social groups are generally children who peers like to play with, possibly due to their ability to mediate between peers, integrate diverse social circles, and coordinate interactions between peers in different parts of the network (Neal et al., 2016), which is useful when larger numbers of children are needed for particular sports (e.g., soccer) and games (e.g., at recess). Closeness centrality’s association with both “Like to play with most” and “Admire” nominations indicates that children who are “close” to many others in the network are not only well-liked but also looked up to, representing a form of social accessibility and potential for impact across the entire network (Borgatti et al., 2018). Eigenvector centrality’s connections with “Like to play with most”, “Cool”, and a weak negative association with “Like Least” suggest that this measure captures a more complex form of social status, potentially representing a form of popularity that combines being liked, perceived as cool, and having high-status friends (Cillessen & Marks, 2011). These findings contribute to a more nuanced understanding of how different aspects of social network position relate to peer perceptions and social functioning in elementary school settings, offering valuable insights for both researchers and practitioners working to support children’s social development and well-being in school contexts.
Despite its contributions, this study has several limitations that should be acknowledged. First, the cross-sectional design limits the ability to make causal inferences about the relationship between social network centrality and peer-nominated social functioning. Future research should employ longitudinal designs to examine how these relationships evolve over time and identify potential bidirectional associations between social network position and social reputation (Bond et al., 2017). Second, the study relied on peer nomination methods, which may be subject to biases and social desirability effects. Furthermore, the peer nomination procedure used a fixed-choice design, which might have artificially limited the number of peers who children nominated. Children may be affected by social norms, friendship ties, or personal biases when making peer nominations, which could affect their accuracy and validity (Cillessen & Marks, 2017). Future studies should consider incorporating additional sources of data, such as teacher reports, self-reports, or observational methods, to triangulate the findings and provide a more comprehensive understanding of children’s social experiences (Cillessen & Bukowski, 2018). Additionally, the sample of this study was limited to elementary school students in semi-rural communities in the southeastern United States, which may limit the generalizability of the findings to other populations and cultural contexts. The social dynamics in semi-rural settings might differ from those in urban or suburban areas due to factors such as smaller community size, potentially more stable social networks, and different cultural norms. These geographical and community attributes could impact the formation and structure of social networks, as well as the relationship between network centrality and peer perceptions. For instance, in smaller, more close-knit communities, the distinction between different types of social status (e.g., popularity vs. likability) might be less pronounced. Additionally, the southeastern U.S. context may have unique cultural factors that shape peer relationships and social hierarchies in ways that differ from other regions or countries. Future research should replicate and extend these findings in diverse samples and settings to examine the cross-cultural validity and applicability of the results (Rubin et al., 2011).
It is also important to note limitations associated with the shortest path analyses. Bringmann et al. (2019) caution that shortest path measures assume that relationships between variables follow the most direct or efficient routes, which may oversimplify how social interactions really work. In complex social networks, influence may not spread in such straightforward ways, especially when negative connections are involved. As a result, these measures may not fully capture the more nuanced dynamics of children’s peer relationships, and their interpretation should be approached with care. Future research should incorporate longitudinal designs to observe how relationships and influence change over time. Studying networks at multiple time points would provide deeper insights into how social dynamics evolve, allowing researchers to better capture the complexity of peer interactions that static models might miss.
In conclusion, this study represents a significant step toward integrating SNA into child development research to better understand the complex interplay between social network position and social reputation in elementary school classrooms. By demonstrating the value of combining SNA centrality measures and peer nomination methods, this study opens up new avenues for research and practice aimed at supporting children’s social competence, peer relationships, and overall well-being. The insights gained from this study can inform the development of targeted interventions and strategies to create inclusive and supportive learning environments that foster the positive social and emotional development of all children. As researchers and practitioners continue to explore the dynamic and multifaceted nature of children’s social experiences, integrating social network analysis and child development perspectives will be essential for advancing our understanding of the complex social processes that shape children’s development and informing evidence-based practices to support their social and emotional well-being.