Figure 1:
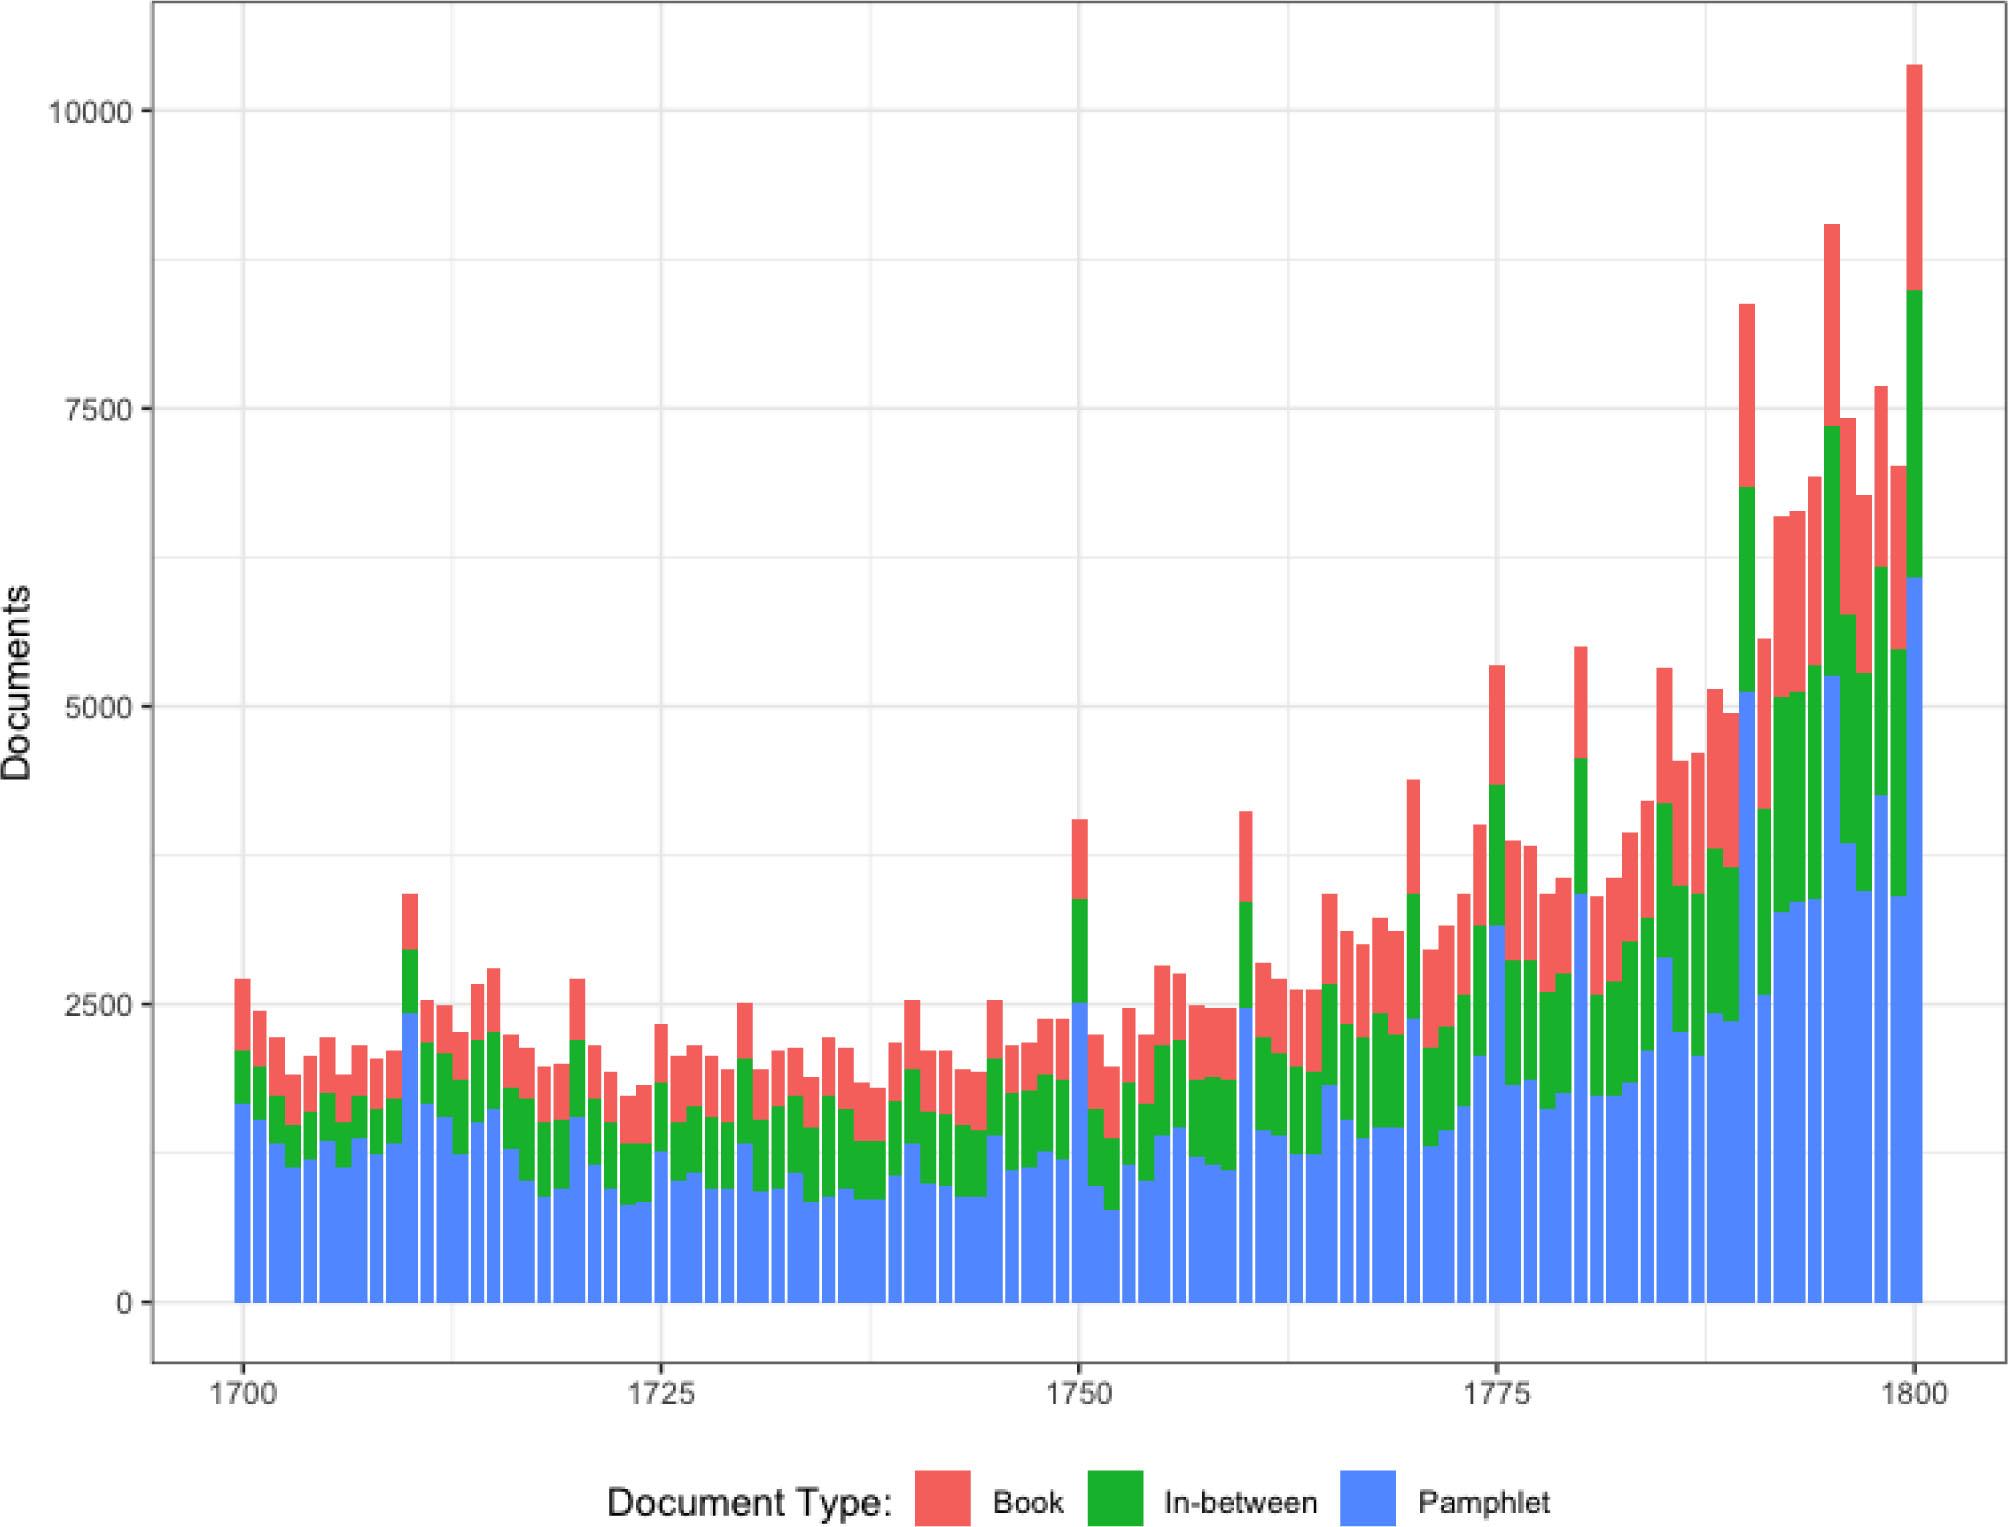
Figure 2:

Figure 3:
Figure 4:
Figure 5:
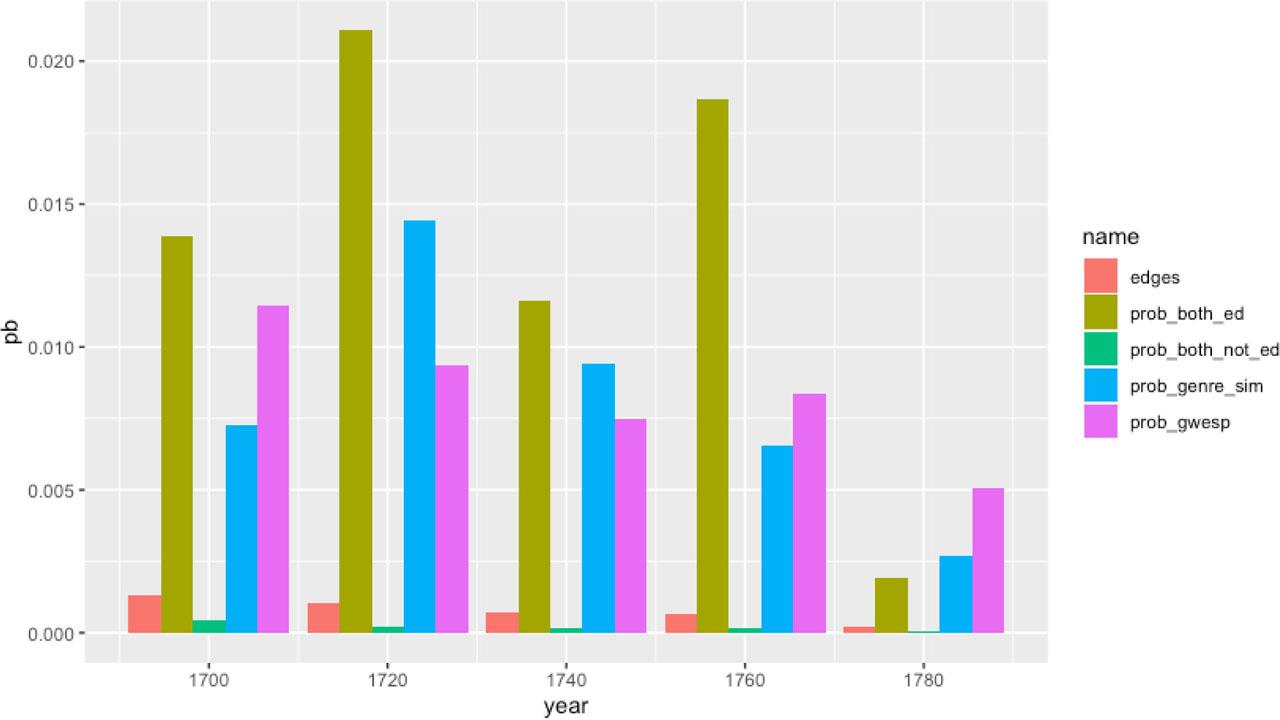
Log-odds for all covariates used by the model_
| Time slice | 1700 | 1720 | 1740 | 1760 | 1780 |
|---|---|---|---|---|---|
| Edges | 6.63*** | 6.92*** | 7.29*** | 7.48*** | 8.41*** |
| 0.08 | 0.08 | 0.08 | 0.11 | 0.07 | |
| nodematch.is_ed.no | 0.55*** | 0.81*** | 0.77*** | 0.80 *** | 0.57*** |
| 0.03 | 0.04 | 0.04 | 0.07 | 0.06 | |
| nodematch.is_ed.yes | 1.14*** | 1.52*** | 1.40*** | 1.67*** | 1.20*** |
| 0.06 | 0.05 | 0.04 | 0.06 | 0.11 | |
| nodecov.p_scot | 0 | 0.02** | 0.01** | 0.02*** | 0.01 |
| 0.01 | 0.01 | 0 | 0 | 0.01 | |
| gwesp.fixed.0.01 | 2.17*** | 2.24*** | 2.38*** | 2.61*** | 3.11*** |
| 0.06 | 0.07 | 0.07 | 0.09 | 0.08 | |
| nodematch.actor_gender.female | 0.25 | 0.31 | 1.02* | Inf | Inf |
| 0.42 | 0.33 | 0.41 | |||
| nodematch.actor_gender.male | 0.23*** | 0.10*** | 0.18*** | 0.30*** | 0.19*** |
| 0.02 | 0.03 | 0.03 | 0.05 | 0.04 | |
| absdiff.p_scot | 0.04*** | 0.02** | 0.04*** | 0.03*** | 0.02* |
| 0.01 | 0.01 | 0.01 | 0.01 | 0.01 | |
| absdiff.publication_year | 0.05*** | 0.09*** | 0.08*** | 0.08*** | 0.07*** |
| 0 | 0 | 0 | 0.01 | 0 | |
| edgecov.dist | 1.72*** | 2.70*** | 2.63*** | 2.44*** | 2.49*** |
| 0.06 | 0.06 | 0.06 | 0.07 | 0.08 |
Overview of node and edge attributes derived from ESTC data_
| Attribute | Type | Description |
|---|---|---|
| Percentage of Scottish work | Node | Proportion of work published by Scottish authors |
| “Scottish publisher” | Node | Binary attribute, defined as any publisher whose publication list was at least 25% works by the above Scottish authors. The 25% threshold was chosen after some experimentation—because most publishers published mostly English works, a higher threshold meant not including many important Scottish publishers. |
| Edinburgh publisher | Node | At least 50% Edinburgh publications, regardless of the likely author nationality. |
| Scottish similarity | Edge | The difference in percentage points of the volume of Scottish works published by each node in a pair. |
| Genre similarity | Edge | Genre information was turned into an edge attribute: the number of publications for each publisher in each genre was expressed as a vector, and a similarity matrix was made using the cosine distance between each pair. |
| Publisher gender | Node | Estimated using a rule-based approach on first names |
| Earliest year published | Node | Year of first record in the ESTC. |
| Total works | Node | Total count of records in the ESTC |
Network statistics for each time slice_
| 1700 | 1720 | 1740 | 1760 | 1780 | |
|---|---|---|---|---|---|
| Total nodes | 744 | 810 | 808 | 1,207 | 1,850 |
| Number of components (size of largest) | 16 (708) | 12 (785) | 12 (784) | 26 (1,103) | 25 (1,782) |
| Number of edges | 4,906 | 7,058 | 6,668 | 12,053 | 15,519 |
| Average degree | 13.19 | 17.43 | 16.5 | 19.97 | 16.78 |
| Global clustering coefficient | 0.31 | 0.34 | 0.36 | 0.38 | 0.33 |
| Average local clustering | 0.56 | 0.68 | 0.69 | 0.74 | 0.71 |
| Density | 0.0177 | 0.0215 | 0.0205 | 0.0166 | 0.0091 |
| Modularity (with Louvain) | 0.34 | 0.27 | 0.31 | 0.27 | 0.4 |
| Average distance | 3.09 | 2.88 | 2.95 | 2.9 | 3.15 |
| Booka | 15,810 | 19,519 | 17,644 | 26,250 | 30,263 |
| In-between | 10,730 | 12,916 | 12,882 | 16,787 | 23,927 |
| Pamphlet | 15,822 | 8,544 | 10,203 | 10,611 | 17,513 |
| NA | 1,378 | 2,323 | 2,549 | 4,370 | 5,345 |