Figure 1.
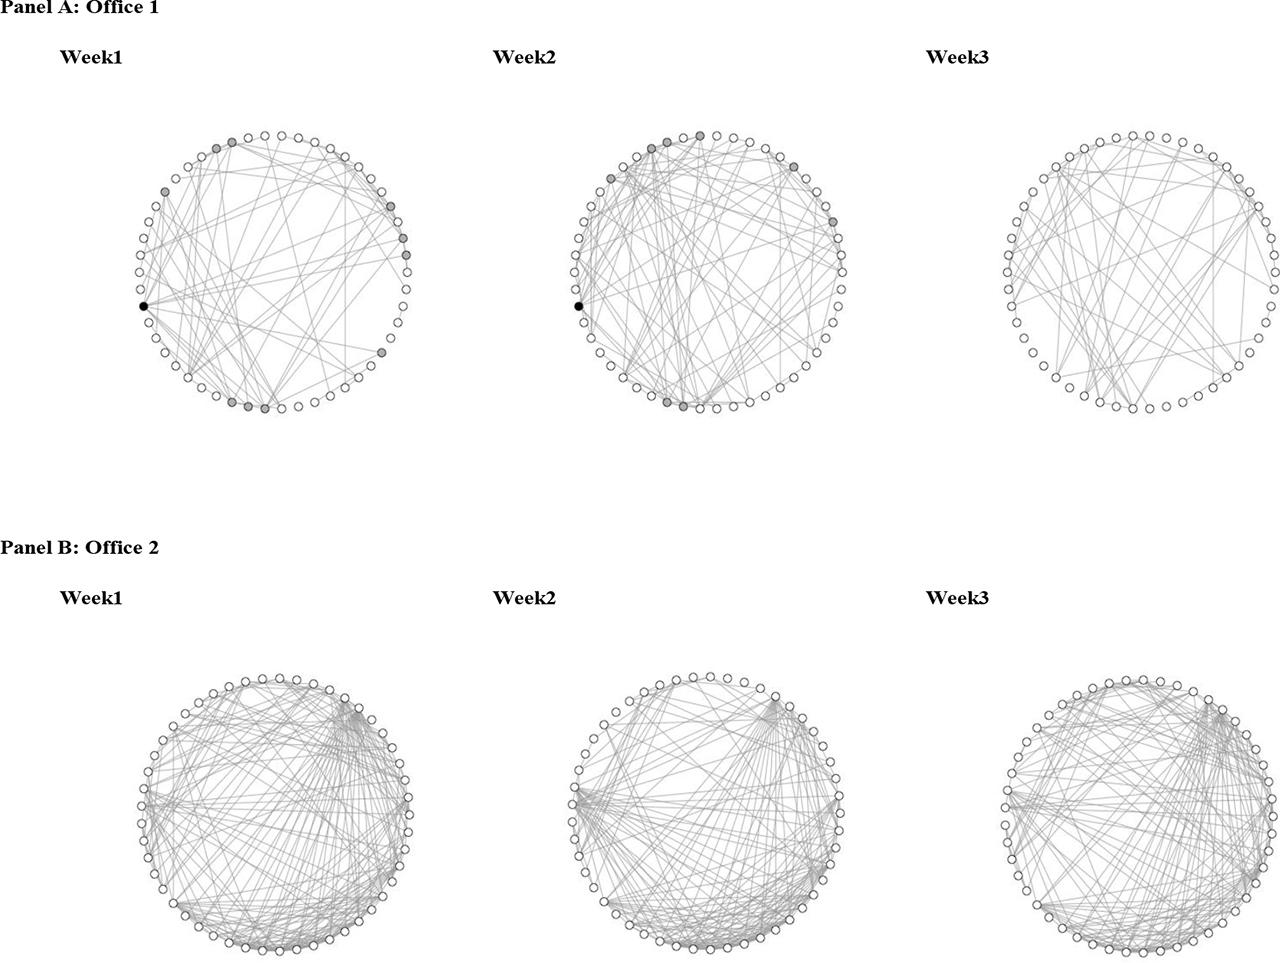
Figure 2.

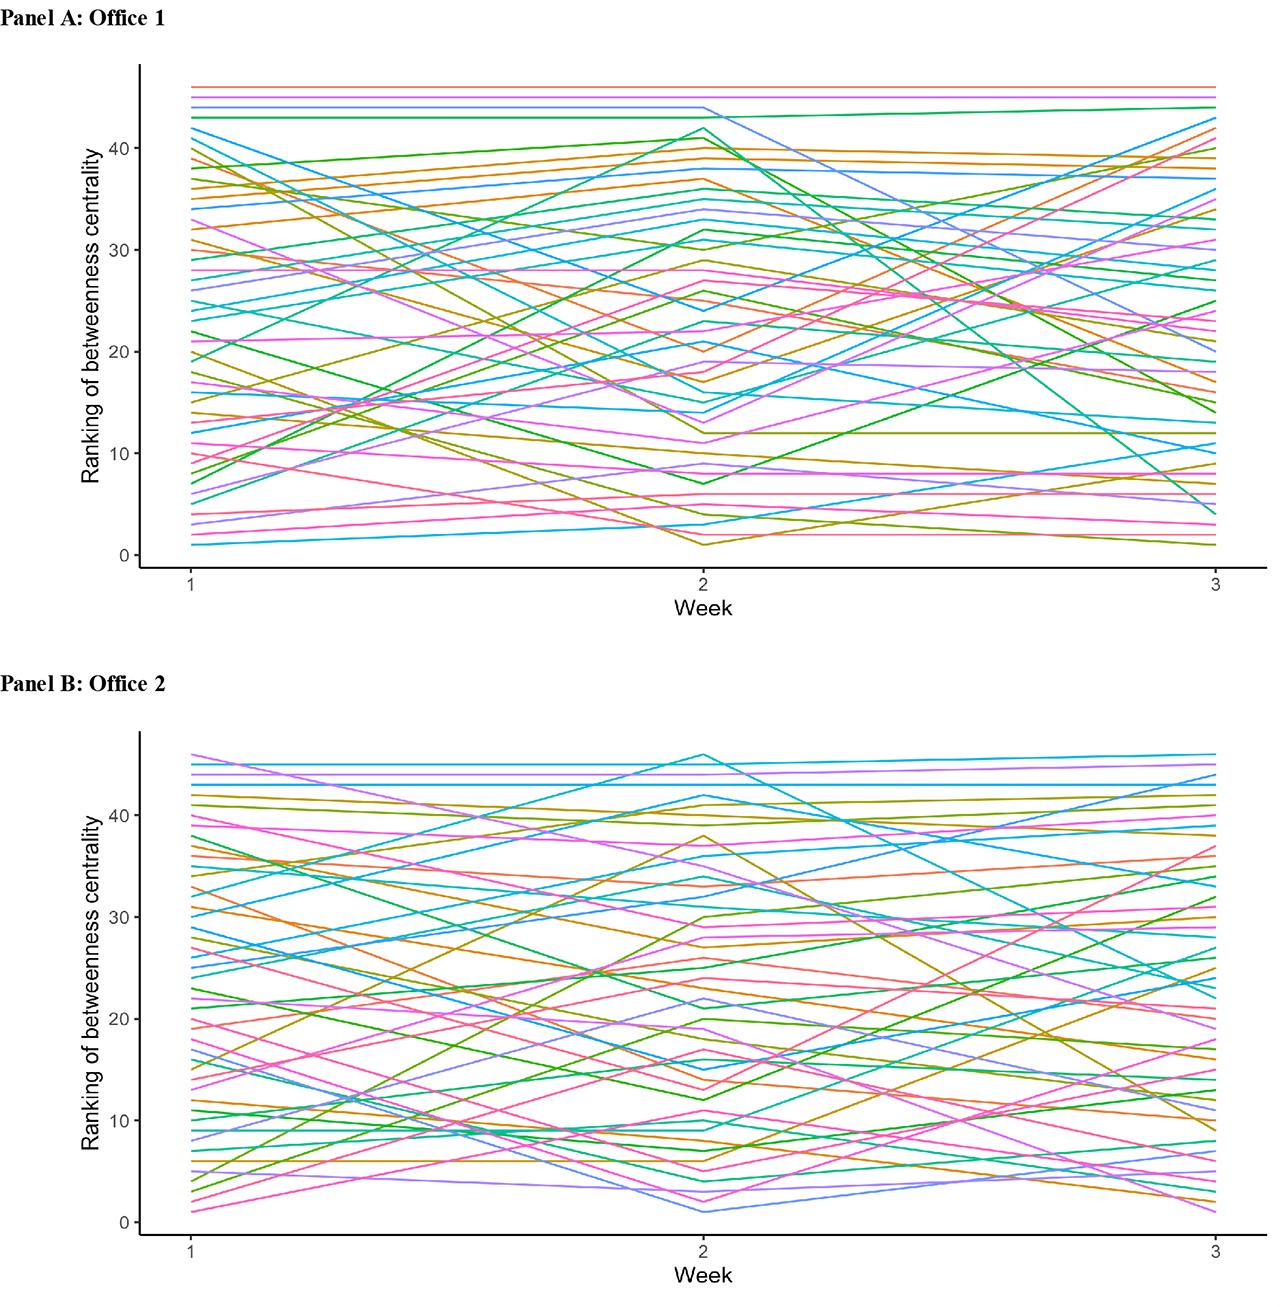
Figure 3:
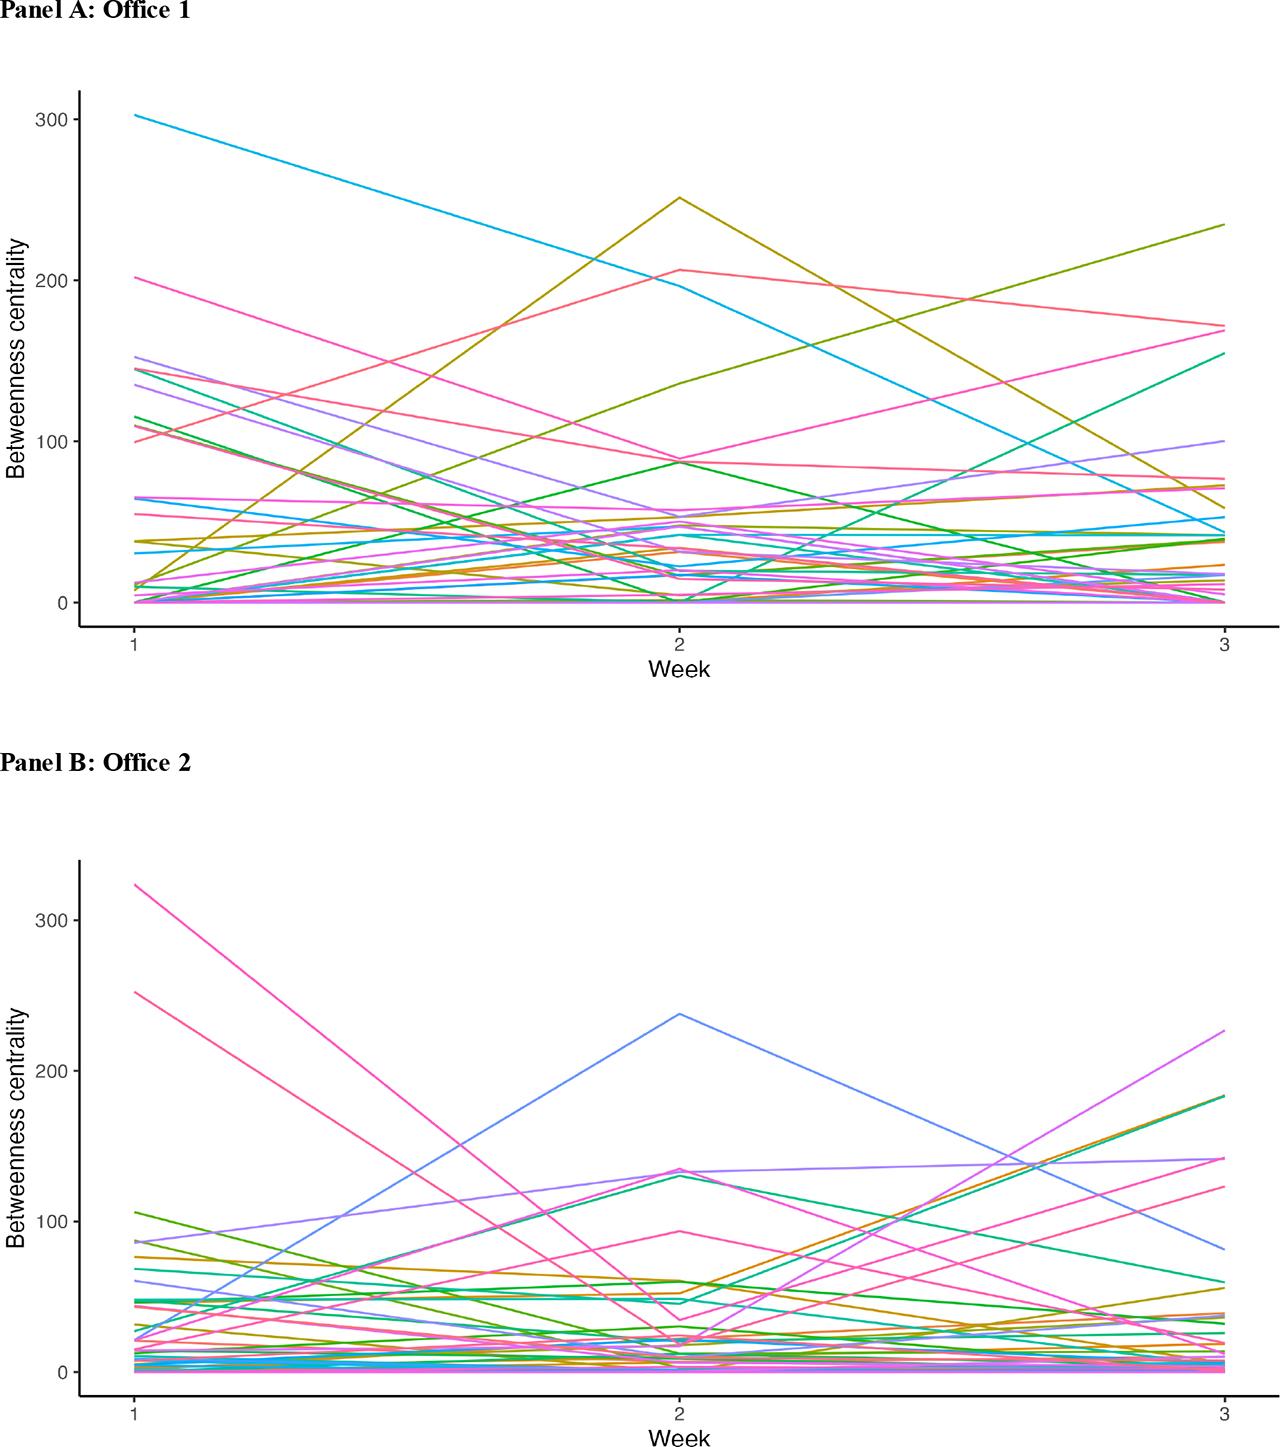
Figure 4:
Ranking of betweenness centrality for the five employees with the highest betweenness centrality in week 1_
| (a) Office 1 | |||
| employee ID | rank (week 1) | rank (week 2) | rank (week 3) |
| 1 | 1 | 3 | 11 |
| 2 | 2 | 5 | 3 |
| 3 | 3 | 9 | 5 |
| 4 | 4 | 6 | 6 |
| 5 | 5 | 23 | 19 |
| (b) Office 2 | |||
| employee ID | rank (week 1) | rank (week 2) | rank (week 3) |
| 1 | 1 | 11 | 4 |
| 2 | 2 | 17 | 6 |
| 3 | 3 | 20 | 17 |
| 4 | 4 | 30 | 35 |
| 5 | 5 | 3 | 5 |
Estimation results on hypothesis 2_
| (1) | (2) | |||||
|---|---|---|---|---|---|---|
| Solving inquiry within the office | Solving inquiry within the office | |||||
| Coef. | SE | p | Coef. | SE | p | |
| Degree centrality (t−1) | 0.00906 | 0.0184 | 0.626 | |||
| Betweenness centrality (t−1) | −0.0105 | 0.0155 | 0.503 | |||
| Office/week/employment status FE | yes | yes | ||||
| Individual FE | yes | yes | ||||
| Adjusted R2 | 0.284 | 0.287 | ||||
| No. of observations | 92 | 134 | ||||
Desctriptive statistics_
| Office 1 | Office 2 | Total | ||||
|---|---|---|---|---|---|---|
| No. of observations: 101 | No. of observations: 113 | No. of observations: 214 | ||||
| mean | SD | mean | SD | mean | SD | |
| Total time of communication | 89.65 | 106.31 | 179.15 | 162.12 | 136.91 | 145.37 |
| Degree centrality | 2.69 | 2.33 | 7.56 | 4.82 | 5.26 | 4.55 |
| Betweenness centrality | 30.64 | 51.03 | 24.95 | 45.58 | 27.63 | 48.20 |
| First response within a specified period | 0.97 | 0.05 | 0.97 | 0.07 | 0.97 | 0.06 |
| Solving inquiry within a specific period | 0.73 | 0.18 | 0.76 | 0.22 | 0.74 | 0.20 |
| Solving inquiry within the office | 0.99 | 0.04 | 0.95 | 0.10 | 0.97 | 0.08 |
Correlations between variables_
| 1 | 2 | 3 | 4 | 5 | |
|---|---|---|---|---|---|
| 1 Total time of communication | - | ||||
| 2 Degree centrality | 0.700* | - | |||
| 3 Betweenness centrality | 0.302* | 0.536* | - | ||
| 4 First response within a specified period | −0.133 | −0.097 | −0.017 | - | |
| 5 Solving inquiry within a specified period | −0.021 | 0.068 | 0.111 | −0.005 | - |
| 6 Solving inquiry within the office | −0.003 | 0.112 | −0.025 | −0.08 | 0.055 |
Estimation results on hypothesis 1_
| (1) | (2) | (3) | (4) | (5) | (6) | |||||||||||||
|---|---|---|---|---|---|---|---|---|---|---|---|---|---|---|---|---|---|---|
| First response within a specified period | First response within a specified period | Solving inquiry within a specified period | Solving inquiry within a specified period | Solving inquiry within the office | Solving inquiry within the office | |||||||||||||
| Coef. | SE | p | Coef. | SE | p | Coef. | SE | p | Coef. | SE | p | Coef. | SE | p | Coef. | SE | p | |
| Degree centrality | 0.00722 | 0.0083 | 0.390 | −0.00690 | 0.0365 | 0.852 | −0.00548 | 0.0148 | 0.713 | |||||||||
| Betweenness centrality | 0.00518 | 0.0055 | 0.354 | −0.0149 | 0.0233 | 0.528 | 0.0323 | 0.0152 | 0.038 | |||||||||
| Office/week/employment status FE | yes | yes | yes | yes | yes | yes | ||||||||||||
| Individual FE | yes | yes | yes | yes | yes | yes | ||||||||||||
| Adjusted R2 | 0.100 | 0.100 | 0.106 | 0.107 | 0.136 | 0.197 | ||||||||||||
| No. of observations | 210 | 210 | 139 | 139 | 211 | 211 | ||||||||||||
Estimation results for Hypothesis 1 (Different threshold minutes)_
| (1) | (2) | |||||
|---|---|---|---|---|---|---|
| Solving inquiry within the office | Solving inquiry within the office | |||||
| Coef. | SE | p | Coef. | SE | p | |
| Betweenness centrality | 0.0245 | 0.0092 | 0.009 | 0.0279 | 0.0155 | 0.076 |
| Office/week/employment status FE | yes | yes | ||||
| Individual FE | yes | yes | ||||
| Adjusted R2 | 0.164 | 0.176 | ||||
| No. of observations | 211 | 211 | ||||
| Threshold minutes | 3 minutes | 7 minutes | ||||
Testing Hypothesis 1 using effective size as the measure of brokerage_
| (1) | (2) | (3) | |||||||
|---|---|---|---|---|---|---|---|---|---|
| First response within a specified period | Solving inquiry within a specified period | Solving inquiry within the office | |||||||
| Coef. | SE | p | Coef. | SE | p | Coef. | SE | p | |
| Effective size | 0.00919 | 0.008 | 0.259 | −0.001 | 0.0401 | 0.970 | 0.0218 | 0.0137 | 0.117 |
| Office/week/employment status FE | yes | yes | yes | ||||||
| Individual FE | yes | yes | yes | ||||||
| Adjusted R2 | 0.118 | 0.092 | 0.186 | ||||||
| No. of observations | 210 | 139 | 211 | ||||||
Rank correlation of the ranking of betweenness centrality between weeks_
| Week 1 and 2 | Week 2 and 3 | |
|---|---|---|
| Office 1 | 0.58 | 0.54 |
| Office 2 | 0.65 | 0.68 |
Estimation results for Hypothesis 1 (Different time windows)_
| (1) | (2) | (3) | |||||||
|---|---|---|---|---|---|---|---|---|---|
| Solving inquiry within the office | Solving inquiry within the office | Solving inquiry within the office | |||||||
| Coef. | SE | p | Coef. | SE | p | Coef. | SE | p | |
| Betweenness centrality | 0.0248 | 0.013 | 0.057 | 0.0122 | 0.021 | 0.558 | −0.0232 | 0.027 | 0.405 |
| Office/week/employment status FE | yes | yes | yes | ||||||
| Individual FE | yes | yes | yes | ||||||
| Adjusted R2 | 0.164 | 0.005 | −0.109 | ||||||
| No. of observations | 196 | 192 | 171 | ||||||
| Time window | 4-days | 3-days | 2-days | ||||||