
Figure 1
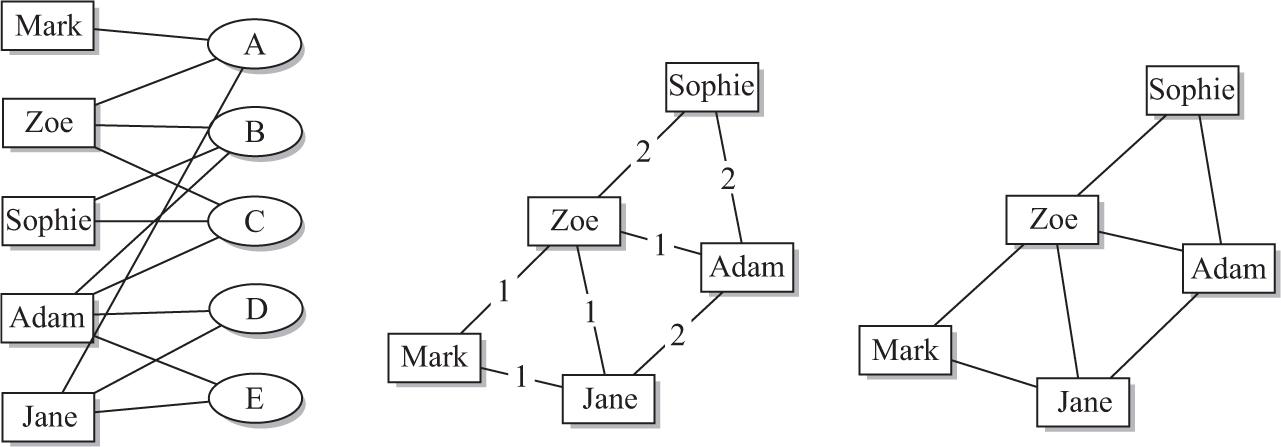
Figure 2
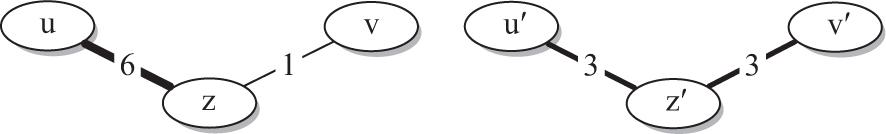
Figure 3
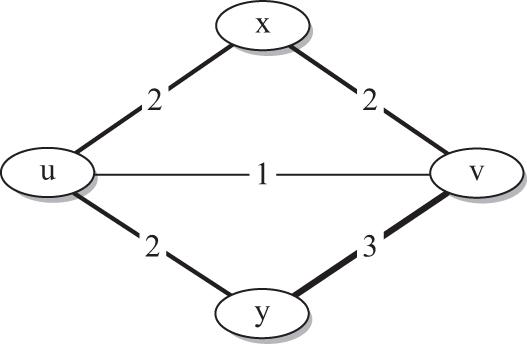
Figure 4
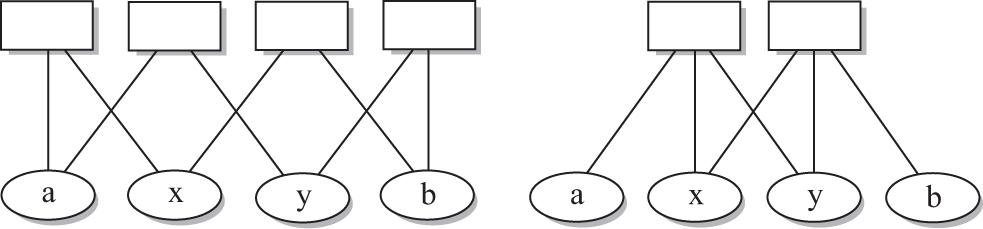
Figure 5
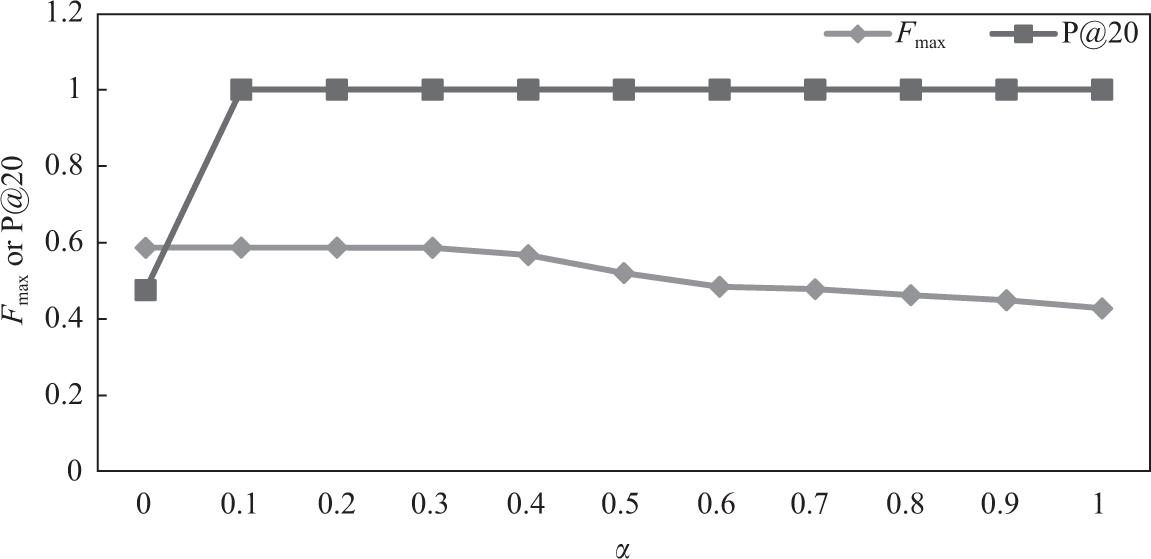
Figure 6
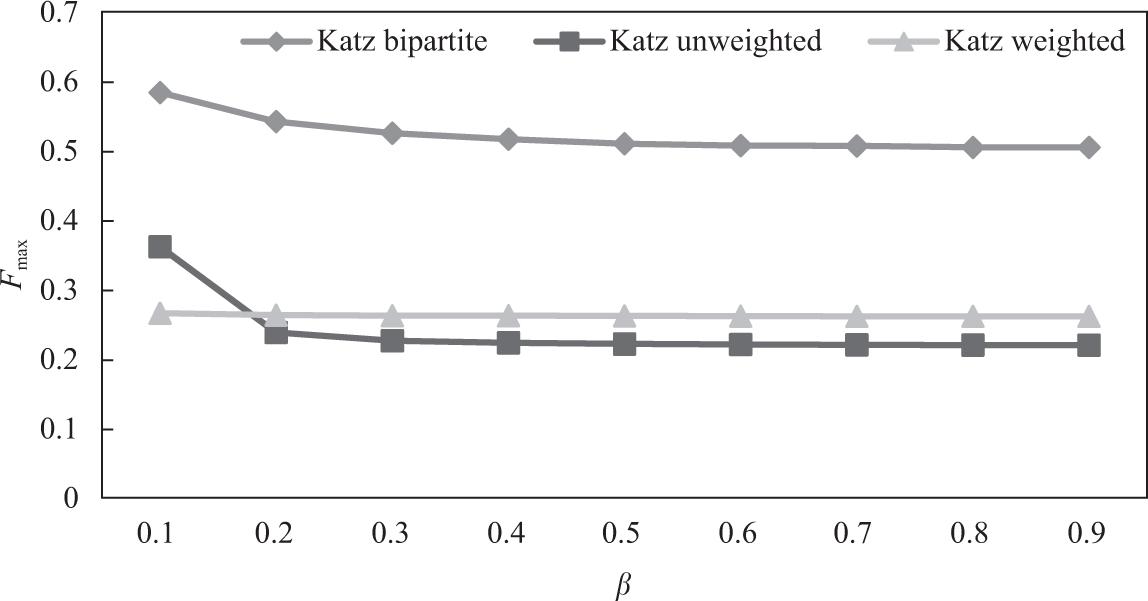
Figure 7
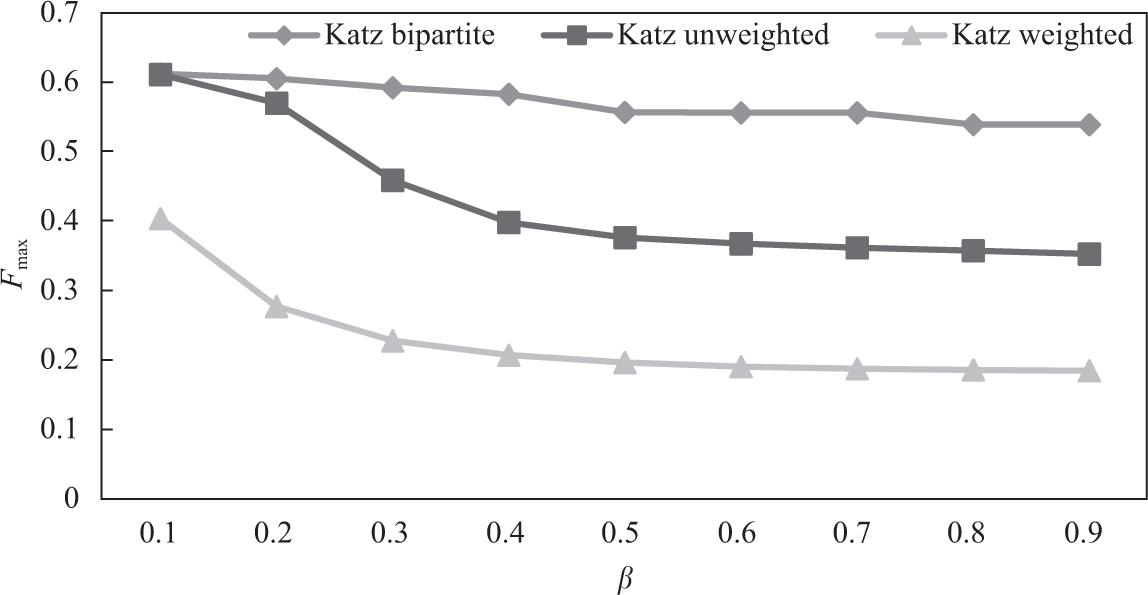
Figure 8
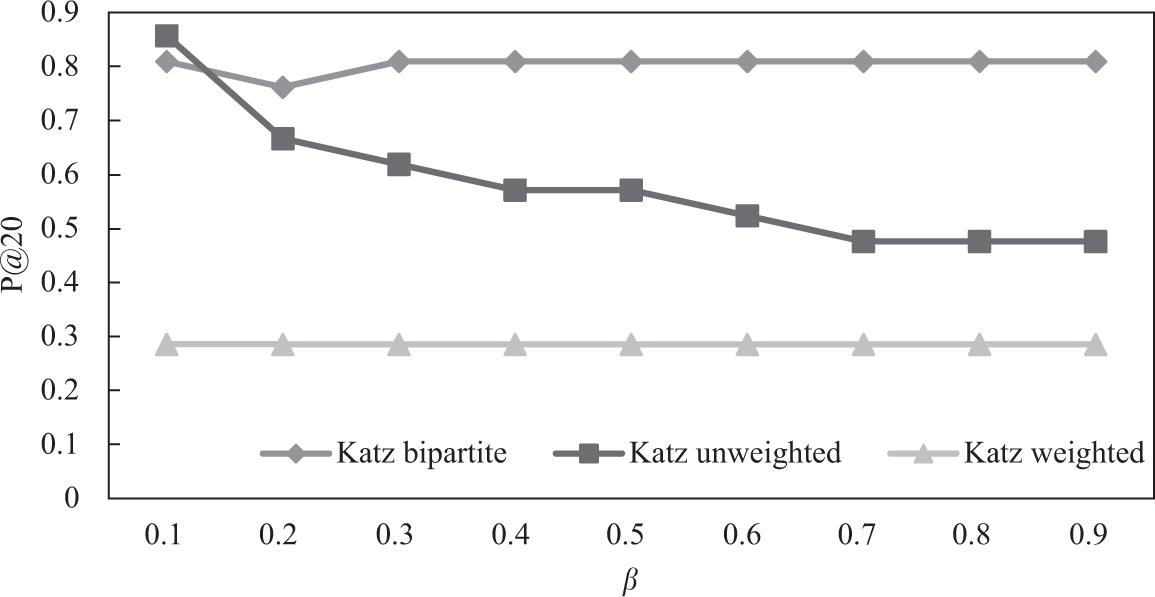
Figure 9
Figure 10
Figure 11
Figure 12
Descriptive statistics of the two datasets_
| UA | INF | ||
|---|---|---|---|
| Training | Number of authors | 1,102 | 397 |
| Number of papers | 7,569 | 1,118 | |
| Average number of papers per author | 11.9 | 4.3 | |
| Average number of authors per paper | 1.7 | 1.5 | |
| Test | Number of authors | 1,102 | 397 |
| Number of papers | 7,939 | 1,069 | |
| Average number of papers per author | 12.8 | 4.4 | |
| Average number of authors per paper | 1.8 | 1.6 |
Results for positive stability_
| UA | INF | |||
|---|---|---|---|---|
| Fmax | P@20 | Fmax | P@20 | |
| Reoccurrence | 0.59 | 0.48 | 0.61 | 0.48 |
| Reoccurrence with weights | 0.59 | 1.00 | 0.61 | 0.81 |
| Reoccurrence with author numbers | 0.55 | 0.52 | 0.61 | 0.57 |
Results for neighborhood-based predictors (UA)_
| Unweighted | Weighted | Bipartite | ||
|---|---|---|---|---|
| Common neighbors | Fmax | 0.3964 | 0.3928 | 0.5866 |
| P@20 | 1 | 1 | 1 | |
| Cosine | Fmax | 0.4025 | 0.397 | 0.5865 |
| P@20 | 0.1429 | 0.0952 | 0.7619 |
Results for neighborhood-based predictors (INF)_
| Unweighted | Weighted | Bipartite | ||
|---|---|---|---|---|
| Common neighbors | Fmax | 0.4091 | 0.3935 | 0.6109 |
| P@20 | 0.8571 | 0.5714 | 0.8095 | |
| Cosine | Fmax | 0.4332 | 0.4305 | 0.6217 |
| P@20 | 0.0476 | 0.0476 | 1 |