Figure 1:
Figure 2:
Figure 3:
Figure 4:
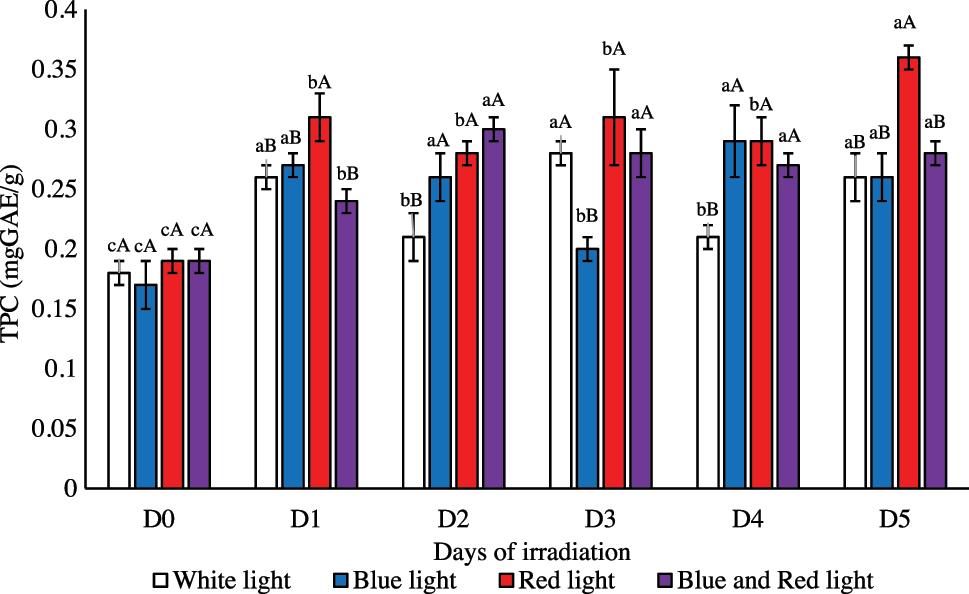
Figure 5:
Figure 6:
Comparison of chemical properties in germinated barley using conventional malting and LED treatments_
| Methods | Sugar content (mg/g) | Total phenolic content (mg GAE/g) | GABA content (mg/g) | Source |
|---|---|---|---|---|
| Normal light for 5 days | 158.75 | nsa | 2.18 | [23] |
| Normal light for 35 h | nsa | 0.2 | 0.16 | [24] |
| Normal light for 6 days | nsa | 3.83 | 1.16 | [25] |
| Normal light for 2 days | nsa | 21.27 | 0.12 | [26] |
| Red light for 5 days | 170.0 ± 10.0 | 1.35 ± 0.15 | 2.75 | This work |